For our current equity setups, read the INTU Double Bottom and the Bloom Energy Bearish Setup.
NVIDIA (NVDA) and Oracle (ORCL) are showing sharply divergent technical pictures this week. NVDA continues to trade constructively inside its multi-year rising channel, holding above key weekly moving averages after a strong +4.03% weekly close. Oracle, on the other hand, has broken its ascending trendline support and is testing a critical decision zone near $140 after a -2.48% weekly decline from its 2026 highs.
This analysis breaks down the exact levels that matter for both names heading into the rest of July 2026.
For more large-cap technical setups, also read our PLTR and MU Bearish Breakdown Analysis and MSFT Head and Shoulders Setup.
NVDA Stock Analysis — Bullish Inside the Range
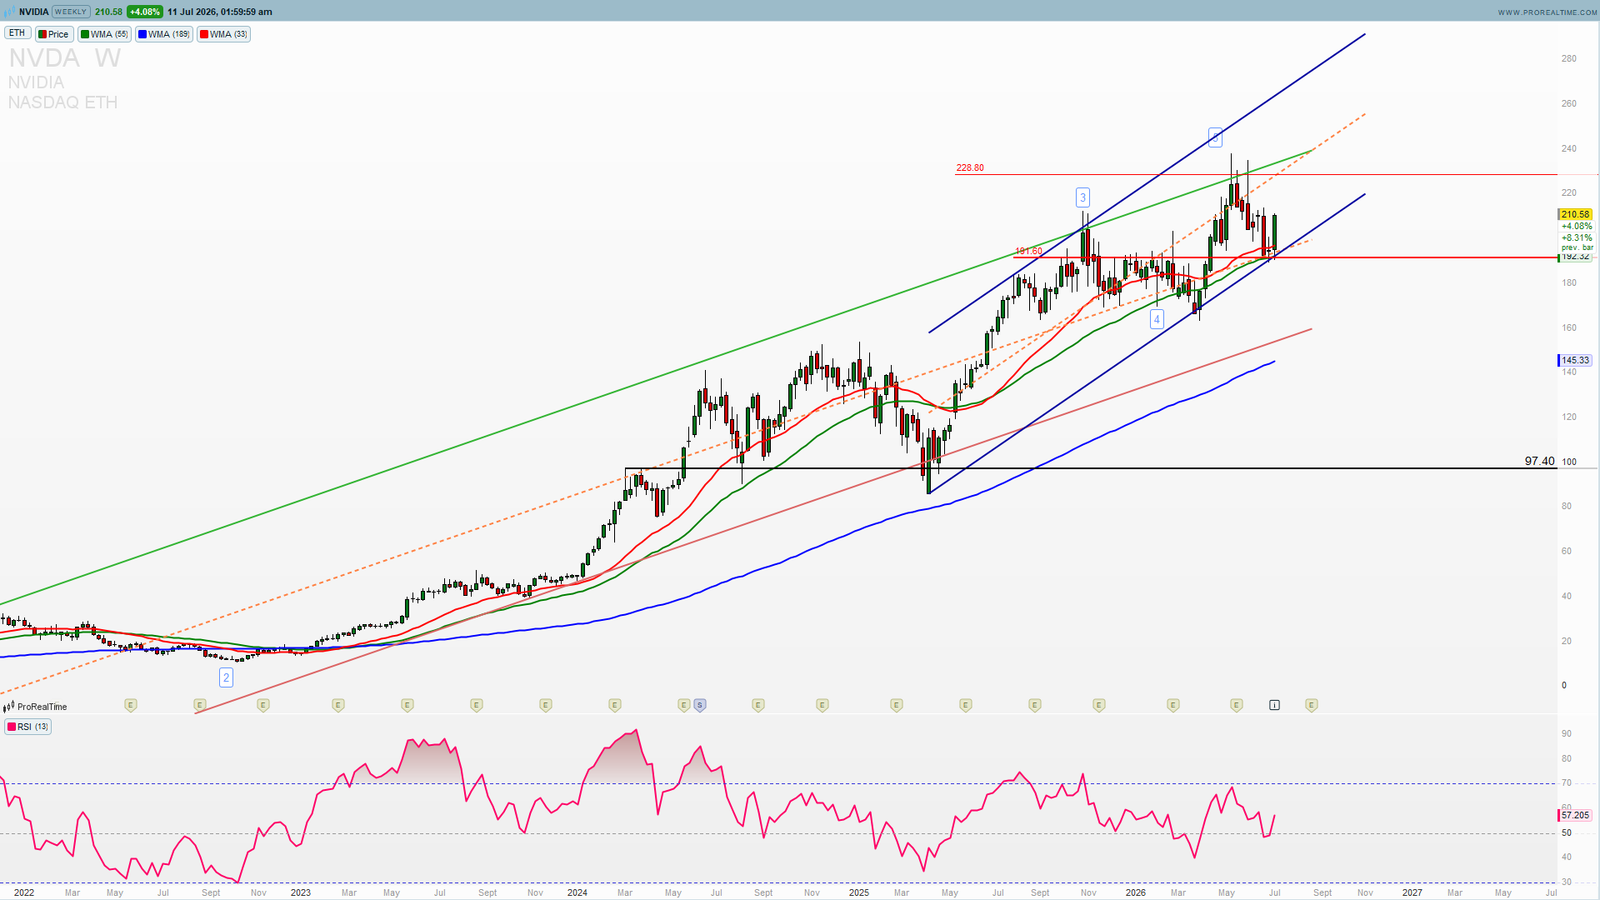
NVIDIA closed the week at $210.96, up $8.18 (+4.03%), continuing to trade inside the long-term ascending channel that has defined the stock’s structure since 2023.
The Channel Structure
NVDA has respected a well-defined rising channel on the weekly chart for over two years — the upper red trendline connecting the 2023 and 2025 highs, and the lower red trendline connecting the corresponding swing lows. Price is currently trading in the upper-middle portion of this channel, well clear of both boundaries, which keeps the broader bullish structure fully intact.
Key Range Levels
Inside the larger channel, NVDA has carved out a tighter trading range between $184.51 and $211.89 over the past several weeks. The stock is currently pressing against the top of that range after this week’s strong close. A weekly close above $211.89 would open the door toward the $236.26 high made earlier in 2026. Below the range, $184.51 is the first support to watch, with $166.99 as the deeper structural floor.
Moving Average Support
Both the WMA 55 ($192.25) and WMA 189 ($145.19) remain well below current price and continue to slope higher, confirming the uptrend has not been structurally damaged. The blue dashed acceleration line — a steeper trendline drawn off the 2025 lows — is also being respected, adding a second layer of near-term support beneath the $192–$200 zone.
Elliott Wave Context
The advance from the 2023 base continues to unfold as a textbook impulsive structure within the channel. As long as price holds above the $184.51 range low and the rising WMA 55, the path of least resistance remains higher, with the $236 prior high as the next major resistance test.
NVDA Key Levels
🟢 BULLISH ABOVE $184.51
Price holding the current range keeps the bullish structure fully intact:
$211.89 — Range high / near-term resistance, break opens $236.26
$236.26 — 2026 high and next major resistance
$192.25 — WMA 55 support (dynamic)
🔴 BEARISH BELOW $184.51
A weekly close below the range low would shift the near-term bias:
$166.99 — Deeper structural support
$145.19 — WMA 189, major trend support
ORCL Stock Analysis — Support Line Broken
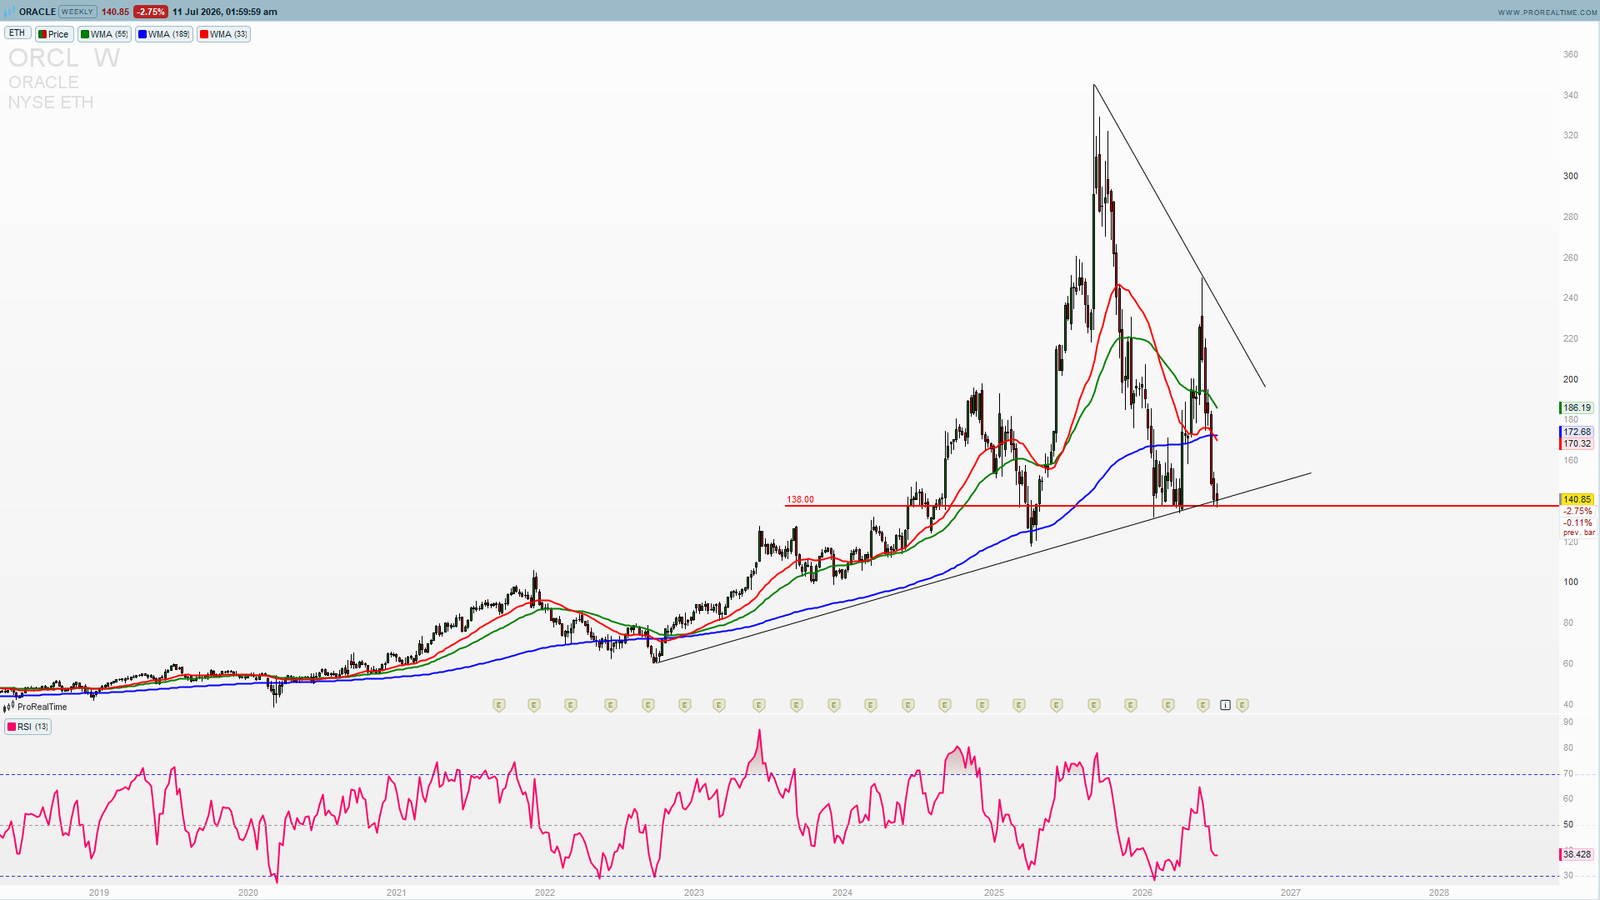
Oracle closed the week at $140.64, down $3.58 (-2.48%), after breaking below the ascending trendline that had supported the stock’s advance since mid-2024.
The Broken Support Line
The dashed ascending trendline connecting Oracle’s 2024 and 2025 swing lows has now been decisively broken. This trendline had acted as reliable dynamic support through multiple pullbacks over the past 18 months — the break represents a meaningful shift in the stock’s short-term structure, even though the stock remains far below its 2026 high of $341.82 already.
Key Support Zone
Oracle is now testing the $138.82–$140.64 horizontal support zone — a level that previously acted as resistance during 2024 consolidation before becoming support on the way up. This zone is the line in the sand for Oracle right now. Holding it keeps the stock in a broad basing pattern; losing it opens a clear path toward the $106.78 low.
Moving Average Structure
Both the WMA 55 ($185.29) and WMA 189 ($170.48) sit well above current price, confirming Oracle has moved into a corrective phase after its parabolic 2025 rally toward $341.82. The descending resistance line (black dashed, drawn from the all-time high) continues to cap any recovery attempts, currently intersecting the mid-$190s.
Elliott Wave Context
The rally from the 2024 lows to the $341.82 high counts as a complete impulsive structure, and Oracle is now in a corrective phase. The break of the ascending support trendline suggests the correction is not yet finished. A clean hold of the $138–$140 zone would suggest a basing process is underway; a break below opens room toward the 2024 low near $106.78.
ORCL Key Levels
⚠️ NEUTRAL-TO-BULLISH ABOVE $138.82
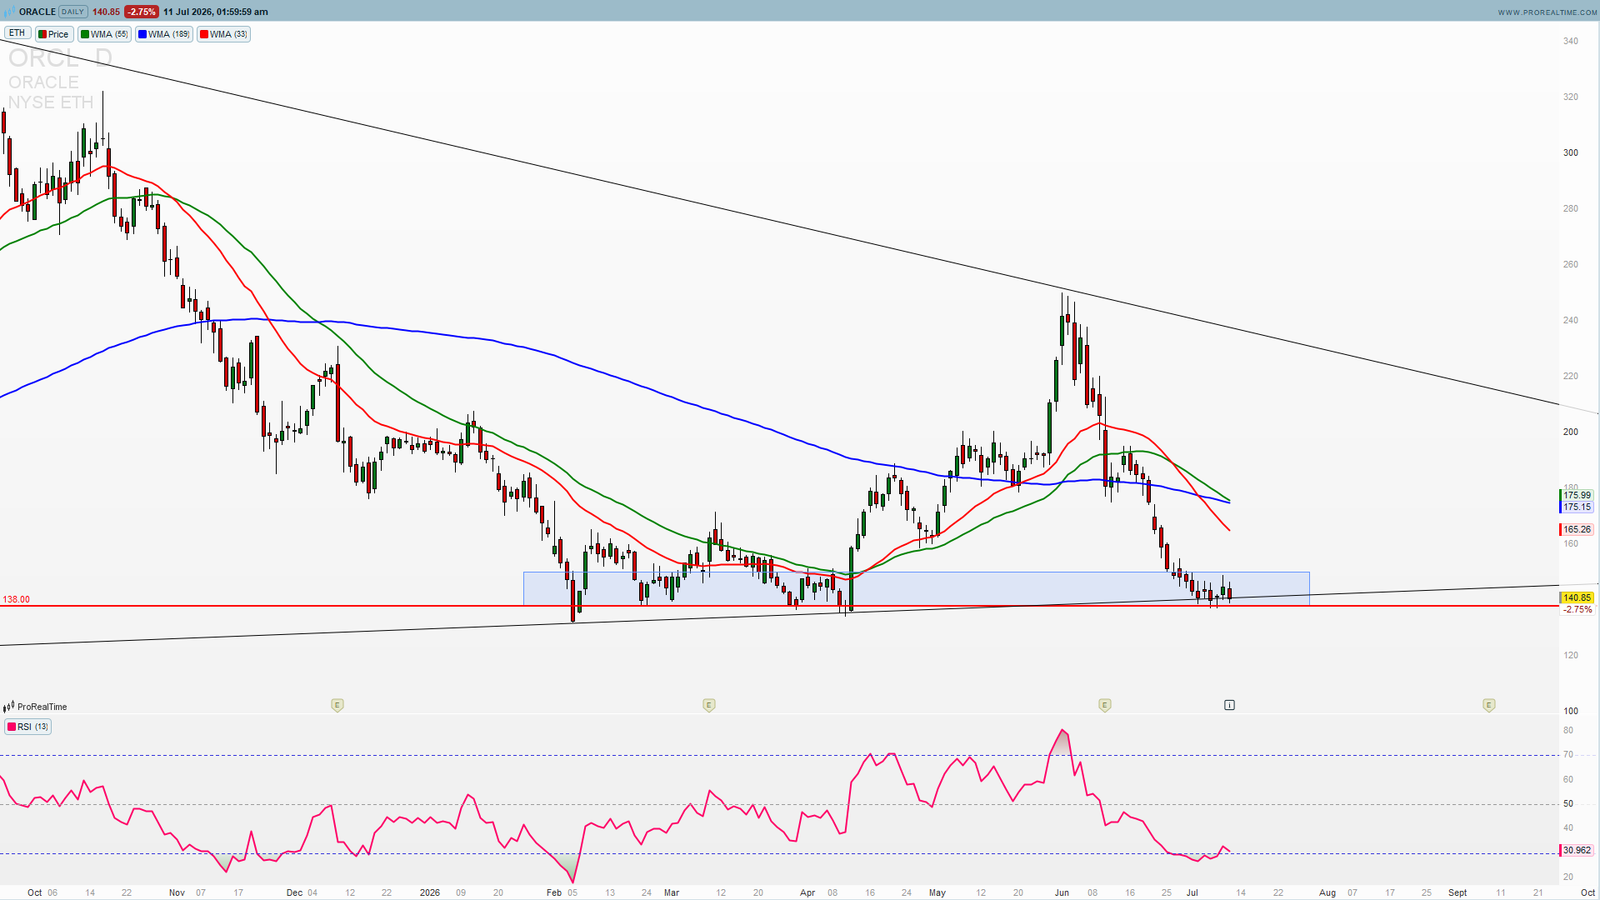
Holding this zone keeps Oracle in a basing pattern rather than a fresh breakdown:
$140.64 — Current price / immediate resistance to reclaim
$170.48 — WMA 189, first major resistance on any recovery
$195.33 — Prior structural resistance zone
🔴 BEARISH BELOW $138.82
A weekly close below this zone confirms trend continuation lower:
$106.78 — 2024 low and next major downside target
Descending trendline from the $341.82 high continues to cap upside on any bounce
What to Watch This Week
NVDA — Range Breakout Watch
The key question for NVIDIA is whether this week’s strong close carries through to a weekly close above $211.89. A confirmed breakout targets the $236 prior high; failure to hold above $200 keeps the stock rangebound between $184 and $212 for now.
ORCL — Support Hold or Break
Oracle’s $138.82–$140.64 zone is the single most important level on the chart right now. A bounce from here with reclaim of $150+ would suggest the broken trendline was a shakeout rather than a genuine breakdown. A weekly close below $138 confirms further downside toward $106.78.
NVDA Live Price — Investing.com
ORCL Live Price — Investing.com
NVDA and ORCL — Summary
Two very different technical pictures within the same large-cap tech space:
NVDA at $210.96:
🟢 Bullish above $184.51 — range breakout targets $236
🔴 Range breaks down only below $166.99
ORCL at $140.64:
⚠️ Neutral above $138.82 — needs to reclaim $150+ to repair the chart
🔴 Bearish below $138.82 — opens $106.78
NVIDIA remains the stronger technical structure of the two, still trading comfortably within its multi-year rising channel. Oracle’s broken trendline is the more important development this week — the $138–$140 zone will likely determine whether the stock stabilizes or extends its correction from the $341.82 highs.
Want the full institutional-grade research behind these names? Our 11-report bundle covers NVDA and 10 other high-conviction tickers — OPEN, CRWD, SPCX, KEEL, PLTR, MU, CRWV, SKHY, TSLA and AMD — with ratings, price targets, and full bull/bear case breakdowns for €79 (regularly €270+).
—
Disclaimer: This analysis is for educational purposes only and does not constitute financial advice. Trading involves significant risk. Always conduct your own research before making any investment decisions.