For related setups, also read our Gold Bearish Setup and our Bloom Energy Bearish Setup.
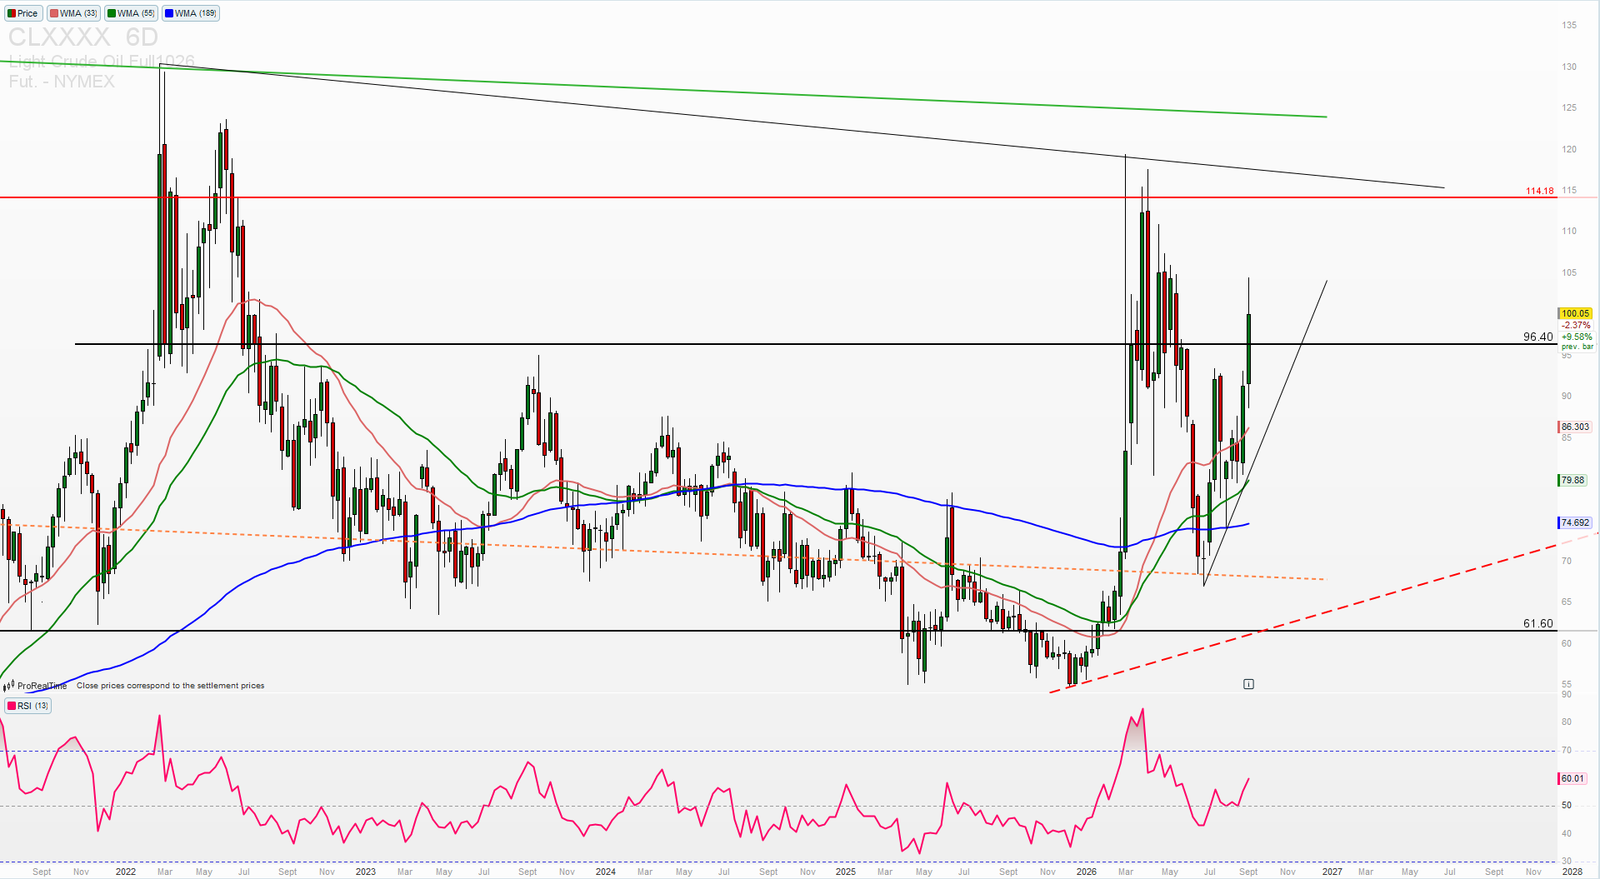
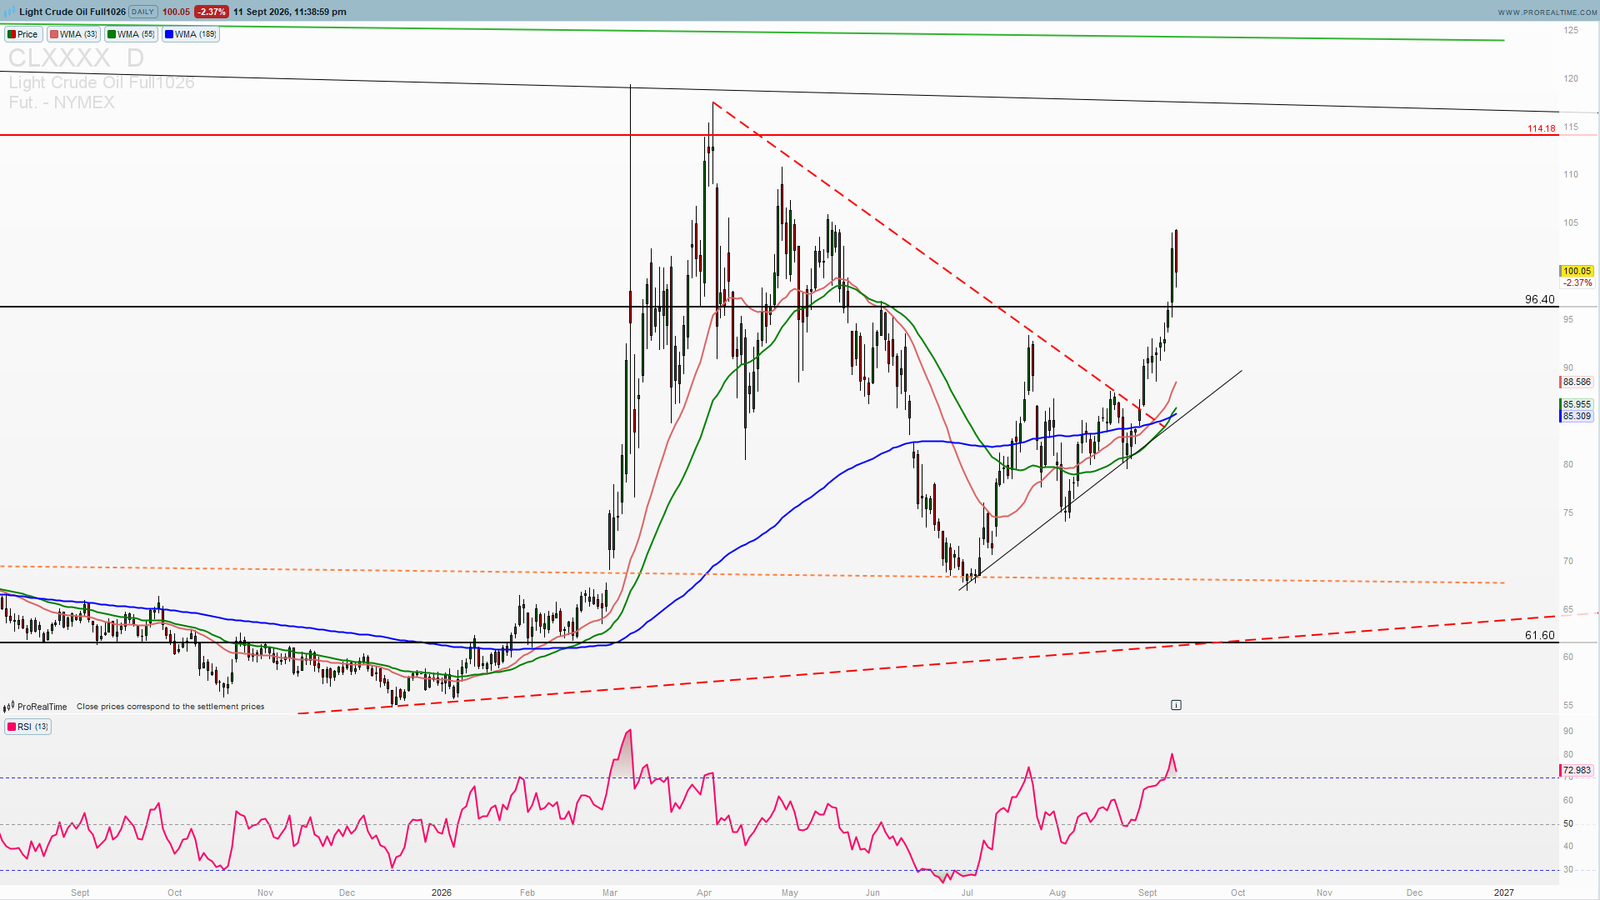
The oil breakout is now the dominant structure on the WTI crude chart. Price surged to $100.05, clearing the descending trendline that had capped every rally since the early-2026 spike, and reclaiming all three moving averages in the process. Today’s session is down 2.37%, but that follows a previous bar that gained 9.58% — this is a pullback inside a breakout, not a reversal of it.
The level that matters from here is $96.40. That was resistance for most of the recent consolidation range, and the breakout has now flipped it into support. Holding above it keeps the bullish structure intact; losing it puts the breakout back in question.
Oil Breakout — Clearing the Descending Trendline
The 6-day chart shows crude basing near $61.60 through most of 2025 before staging a sharp, high-momentum rally that took out the WMA(33) at $86.30, the WMA(55) at $79.88, and the WMA(189) at $74.69 in quick succession. That’s a full moving-average stack reclaim — not a slow grind, but a decisive shift in trend.
The Trendline Break Is the Signal
The descending trendline connecting the early-2026 spike high down through the subsequent lower highs had capped every recovery attempt for months. Price closing back above it, on expanding range, is exactly the kind of structural break that separates a genuine trend change from another failed bounce.
RSI at 60 Leaves Room to Run
The RSI(13) sits at 60.01 — comfortably elevated and confirming real momentum behind the move, but still well short of the overbought readings above 70 seen earlier in the cycle. That leaves room for continuation before the rally becomes technically stretched.
$96.40 Now Has to Hold
The pivot that repeatedly rejected price during the consolidation phase is now the first test of the breakout’s validity. A hold here on any pullback is what turns this from a sharp bounce into a confirmed new trend.
WTI Key Levels — What a Move Above $114.18 Would Open
The confluence here is straightforward: a broken descending trendline, a full moving-average reclaim, and one major level standing between current price and the next resistance zone.
Next Target: $114.18
This is the level that capped the early-2026 spike and has held as long-term resistance since. A sustained move through it would confirm the breakout has legs beyond the initial thrust.
New Support: $96.40
The former resistance pivot. This is the level bulls need to defend on any retracement for the breakout thesis to stay intact.
Secondary Support: $86.30 → $79.88
The WMA(33) and WMA(55). A close back below both would call the breakout into question and point to a failed move back into the prior range.
Structural Floor: $61.60
The base of the entire 2025 range. Only a break back below this level would invalidate the broader bullish structure.
Why This Setup Reads Bullish
The Move Cleared Real Resistance, Not Noise
A single strong candle breaking a multi-month descending trendline and every moving average at once is a higher-conviction signal than a slow grind through the same levels. The follow-through — holding gains after the initial spike — is what separates this from a one-day squeeze.
Supply-Side Context
Oil’s rally is unfolding against a mixed supply backdrop: OPEC now expects a smaller global supply deficit in 2026 after raising output in September, according to ING commentary reported by FXStreet, which keeps the macro picture two-sided even as the chart turns bullish. Traders can follow live WTI crude price action and futures data on Barchart for real-time confirmation.
What to Watch This Week
The $96.40 Retest
Everything hinges on this zone holding on any pullback. A clean hold keeps the path toward $114.18 open. A decisive close back below it would undercut the breakout thesis.
Confirmation Requires Follow-Through
One strong candle is a signal; holding the breakout structure over the following sessions with $96.40 respected as support is confirmation. Until that happens, treat this as an aggressive breakout that still needs to prove itself on the retest.
WTI Summary
WTI Crude at $100.05:
🟢 Bullish above $96.40 — targets $114.18
⚠️ Neutral if price slips back into $86.30–$96.40 — range-bound, breakout under question
🔴 Invalidated on a close back below $79.88 — that would signal a failed breakout back into the prior consolidation
WTI crude broke its descending trendline and reclaimed its full moving-average stack in one decisive move, with RSI confirming momentum well short of overbought. The structure now rests on the $96.40 retest. Hold it, and $114.18 is the next objective; lose it, and this breakout goes back into the range it just left.
Track WTI crude and every major pair, index and metal in real time — live charts, moving average structure, and market bias on one screen with PST Terminal, included with the PST All-Access plan.
—
Disclaimer: This analysis is for educational purposes only and does not constitute financial advice. Trading involves significant risk. Always conduct your own research before making any investment decisions.