Bitcoin entered April 2026 at a critical technical decision point. After topping out near the $120,000–$126,000 all-time high zone, BTC has sold off aggressively, losing both the 50-day and 200-day moving averages and dropping into the $60,000–$70,000 accumulation zone. The question every trader is asking: is this a buyable correction, or the beginning of a deeper bear cycle?
In this analysis, we break down the current Bitcoin price structure, identify the key levels every trader must watch, and explain why our current outlook is neutral to bullish for the weeks and months ahead.
For live Bitcoin price data, visit CoinMarketCap.
For on-chain analysis and holder data, visit Glassnode.
For broader market context, also read our QQQ ETF Nasdaq-100 Analysis and Gold XAU/USD Price Analysis.
Bitcoin Current Market Structure — A Deep Correction in a Bull Market
Bitcoin’s 2025–2026 bull run was one of the most powerful in its history. From the April 2024 halving lows, BTC rallied from approximately $58,000 all the way to an all-time high of $126,021 — a gain of over 117% in under two years. This rally was driven by an unprecedented combination of forces: spot Bitcoin ETF inflows led by BlackRock’s IBIT, post-halving supply reduction, institutional and sovereign adoption, and a weakening US dollar.
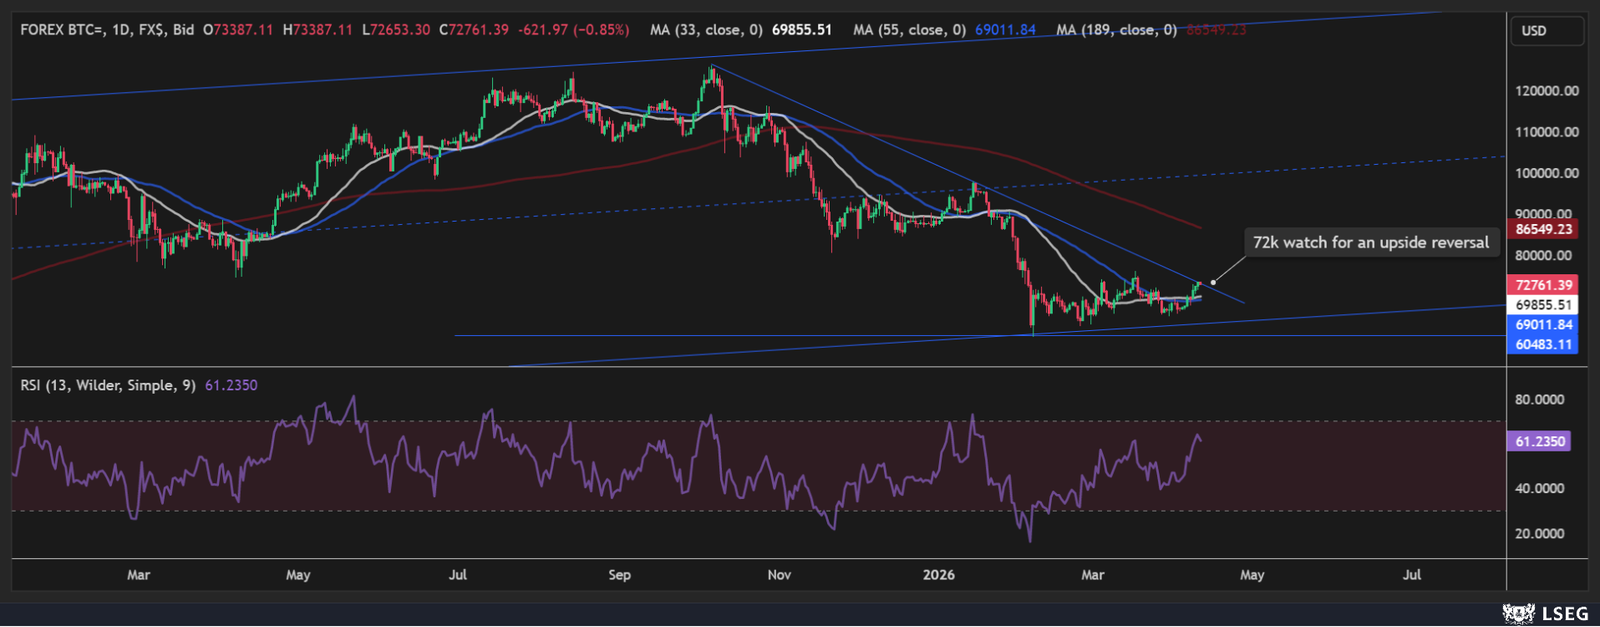
The current correction from those highs has been sharp and aggressive. Bitcoin has retraced more than 40% from its all-time high, falling into the $60,000–$70,000 accumulation zone where significant on-chain buying has been observed. The structure of the correction — five waves down followed by a stabilisation — suggests this may be a corrective phase rather than the beginning of a new bear market.
Bitcoin is currently trading around $70,000–$71,000 as of April 2026, with the $60,000–$65,000 zone having held as major support multiple times.
Key Support and Resistance Levels
$126,021 — All-Time High
The January 2026 all-time high remains the ultimate bull market target. Getting back to these levels would require a confirmed macro recovery and break above the $100,000 psychological level.
$75,000–$78,733 — Major Resistance Zone
The $75,000 level is the key near-term resistance. A sustained break above this zone — particularly a weekly close above $75,900 — would shift the technical structure from defensive to constructive and open the door to the $82,000–$90,000 range.
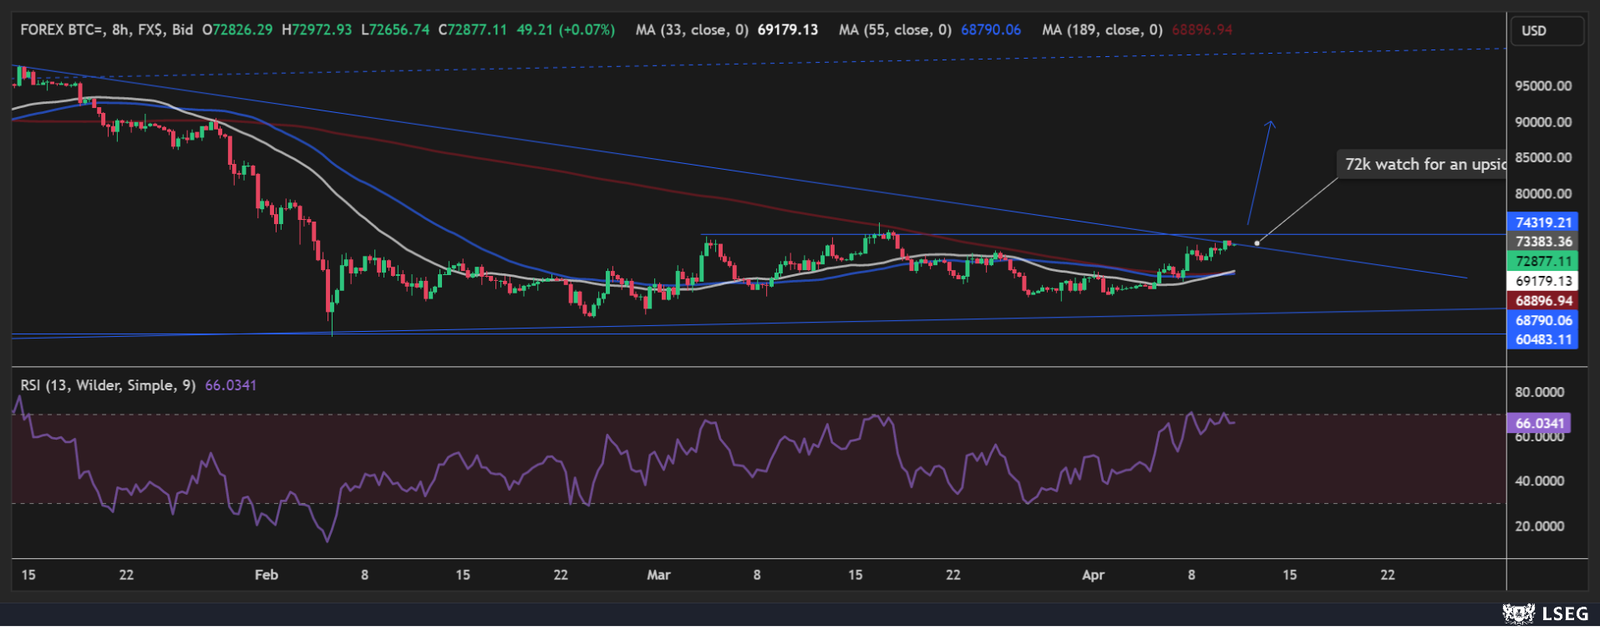
$73,858–$74,300 — Immediate Resistance
This is the first major hurdle Bitcoin must clear. Multiple analysts are watching $74,300 as the line in the sand for short-term bullish momentum. A break above triggers the next leg toward $75,000+.
$70,500–$71,780 — Current Support Zone
Bitcoin is consolidating in this range at the time of writing. The 38.2% Fibonacci retracement sits at $71,780 — a key level that must hold for the neutral-to-bullish case to remain intact.
$68,982–$65,965 — Secondary Support
These levels represent the next lines of defence on a pullback. The $67,000 level has acted as strong support multiple times throughout 2026.
$60,000–$62,000 — Critical Support Floor
This is the most important support zone for the longer-term bull case. A decisive break below $60,000 would represent a significant structural deterioration and would require reassessment of the entire Elliott Wave count.
$64,107 — Strongest Fibonacci Support
The deepest Fibonacci support level in the current structure. A test of this level would represent maximum pain for bulls but also a potential high-conviction accumulation opportunity.
Technical Indicators — Neutral to Bullish Setup
RSI at 49.93 — Neutral, Not Overbought
The 14-day RSI for Bitcoin is sitting at approximately 50 — perfectly neutral territory. This means there is significant room for upside before reaching overbought conditions, unlike during the November–January peak when RSI was pushing above 80.
Fear & Greed Index at 16 — Extreme Fear
The Crypto Fear & Greed Index is at 16 — deep in Extreme Fear territory. Historically, Extreme Fear readings on Bitcoin have preceded strong recoveries. When the crowd is most fearful, the contrarian opportunity is typically at its greatest.
The Fear & Greed Index data is published daily by Alternative.me.
Bitcoin ETF flow data is tracked by Farside Investors.
Post-Halving Cycle Position
Bitcoin is currently 24 months into its post-April 2024 halving cycle. Historically, Bitcoin’s biggest price moves occur 12 to 18 months after a halving — suggesting the peak window was between April and October 2026. The current correction may represent the final shakeout before the next impulse higher.
On-Chain: Long-Term Holders at 78% of Supply
Long-term holders control 78% of Bitcoin’s circulating supply, and exchange reserves are at 6-year lows. This means the available supply for selling is structurally limited — a historically bullish setup.
Institutional ETF Inflows
US spot Bitcoin ETFs pulled in $358 million in a single day in early April 2026, led by BlackRock’s $269 million purchase. This level of institutional buying at current prices is a strong signal that smart money views the $70,000 zone as a significant accumulation opportunity.
Macro Environment — Key Catalysts
US-Iran Geopolitical Situation
A conditional ceasefire between the US and Iran was announced on April 9, 2026, temporarily reducing fears of a broader conflict. If the Strait of Hormuz fully reopens, oil prices would drop significantly — easing inflation fears, increasing the probability of Fed rate cuts, and providing a major tailwind for Bitcoin and risk assets broadly.
Federal Reserve — April 29 FOMC Meeting
The next Fed meeting on April 29 is a critical catalyst for Bitcoin. Any dovish signal — particularly any hint at rate cuts later in 2026 — could trigger a significant rally in Bitcoin, which has been highly correlated with rate expectations throughout this cycle.
MVRV Ratio — Not Overvalued
The MVRV ratio (Market Value to Realised Value) is currently at approximately 1.8 — significantly below the 3.5–4.0 readings that have marked previous cycle tops. This data-driven metric suggests Bitcoin is not overvalued at current prices.
Trade Scenarios — Neutral to Bullish Outlook
Bullish Scenario (Primary):
Bitcoin holds above $70,500 support and reclaims $74,300 resistance on high volume. This would confirm the corrective phase is complete and open the door to $80,000–$90,000 and eventually a retest of the all-time high above $126,000.
Neutral Scenario:
Bitcoin consolidates in the $68,000–$75,000 range through April, waiting for the FOMC meeting catalyst on April 29. A dovish Fed would be the trigger to break higher.
Bearish Risk Scenario:
A break below $67,000 with conviction would signal further downside toward $62,000–$64,000. A break below $60,000 would require full reassessment of the Elliott Wave structure and would open the door to $52,600.
Invalidation for Bull Case: Weekly close below $60,000.
Bitcoin 2026 Price Targets
Based on our Elliott Wave analysis and the broader macro setup, here are our key price targets for Bitcoin in 2026:
Conservative target: $80,000–$90,000 (break above $72,000 resistance)
Base case target: $100,000 (psychological round number and previous ATH zone)
Bull case target: $120,000–$126,000 (retest of all-time high)
The base case for 2026 remains a recovery toward the $80,000–$100,000 range, driven by continued ETF inflows, post-halving supply dynamics, and potential Fed rate cuts in the second half of the year.
Conclusion — Bitcoin at $70K Is a Decision Point
Bitcoin at $70,000 with Extreme Fear readings, massive institutional ETF buying, long-term holders at 78% of supply, and a post-halving cycle that historically peaks between April and October 2026 — this is the setup for a neutral-to-bullish bias.
The critical level to watch is $70,500 on the downside and $74,300 on the upside. A break above $74,300 with volume would be the first concrete signal that the correction is over and the next bull leg is beginning.
Watch the April 29 FOMC meeting closely — it may be the macro catalyst that defines Bitcoin’s direction for the remainder of 2026.
Want real-time Bitcoin levels, Elliott Wave counts, and precise trade setups? Access ProSignalTrades Premium →
—
Disclaimer: This analysis is for educational purposes only and does not constitute financial advice. Trading involves significant risk. Always conduct your own research before making trading decisions.