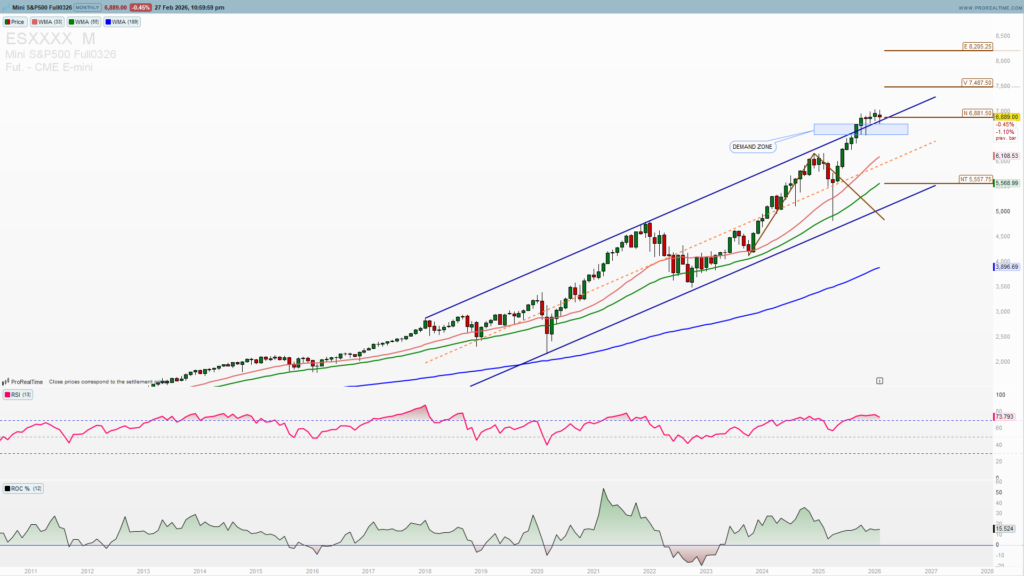
SPX calm before a storm
The SPX briefly touched 7,000 in late January 2026 before a wave of profit-taking pulled it back into a tight range between 6,800 and 7,000. What looks like indecision on the surface may actually be something far more constructive. Institutional investors have continued buying dips while retail traders sell into rallies — a tug-of-war that’s keeping the index in consolidation. In this post, we’ll break down why this standoff may resolve to the upside, and what key levels to watch before the next all-time high.
If you’ve been watching the SPX lately, you’ve probably noticed something: it’s going nowhere fast. No dramatic selloffs, no explosive breakouts — just a slow grind sideways. Frustrating? Maybe. But if history is any guide, this kind of consolidation is often exactly what a healthy bull market looks like before it makes its next big move.
SPX demand zone is holding
SPX is bouncing off the range support 6800. This is a key demand zone to hold for an upside extension and a possible new high. This is also a previously broken multi-month uptrend channel resistance which is now acting as a good support. For a substantial reversal lower we need to see a strong close below 6500.
Distribution time is getting to an end
Weekly chart reveals that support zone is 6700-6820 and any possible dip to this zone should be used for buying as I believe distribution consolidation time is coming to an end.
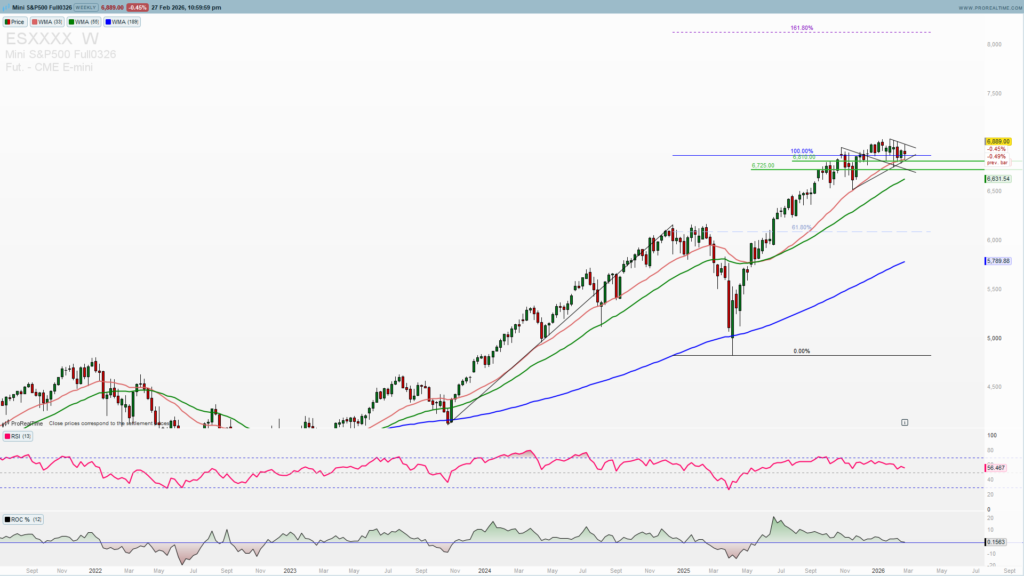
On this weekly chart you can see a possible bullish flag formed (join to get premium analysis, weekly and mid-week newsletter and other tools for for your successful trading ) above the support zone. A break above 6900 and a weekly close above this level is needed for an extension higher to 7000 and higher. Dips to support zone and especially 6700 should be used for buying.
Trade this setup with my preferred broker 👇
On a daily chart it is visible that consolidation near the demand zone is supported with a lower highs and a pressure is rising with retail traders giving up from short trades and as they are exhausted form range trading.
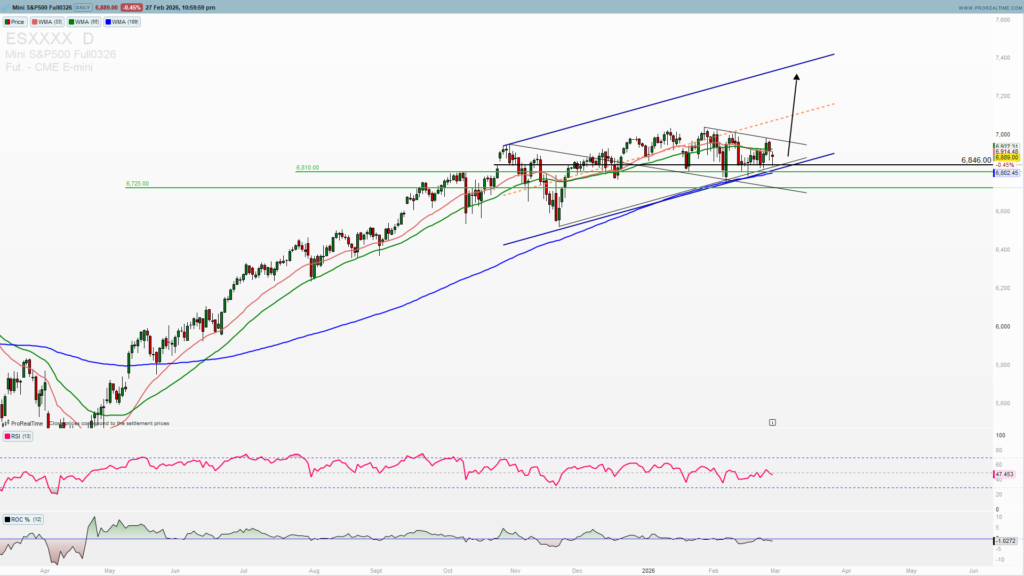
Trading setup is perfect and I have been waiting for a long time for this to clear out and a squeeze to come to an end. This will lead to a strong explosive move
Trade safe!