Two of the most widely traded technology stocks — Palantir Technologies (PLTR) and Micron Technology (MU) — are flashing simultaneous bearish breakdown signals heading into July 2026. Both charts show broken structural support levels, deteriorating RSI readings, and price action consistent with an extension lower that mirrors their previous major corrections.
PLTR has broken below the critical $125.41 horizontal support on the weekly chart after failing to hold the broken rising channel, while MU has cracked its parabolic uptrend line on the daily chart following a rejection from $1,255 highs — and is trading below the 50-day moving average for the first time in months.
This analysis identifies the key breakdown levels, downside targets, and the specific price triggers that would confirm or invalidate the bearish thesis for both stocks.
For broader market context, also read our Gold XAUUSD Analysis and Bitcoin BTC/USD Outlook.
PLTR Stock Analysis — Weekly Chart Breakdown
Palantir’s weekly chart tells a clear story of a stock that has exhausted its parabolic move and is now undergoing a structural reset.
The Broken Rising Channel
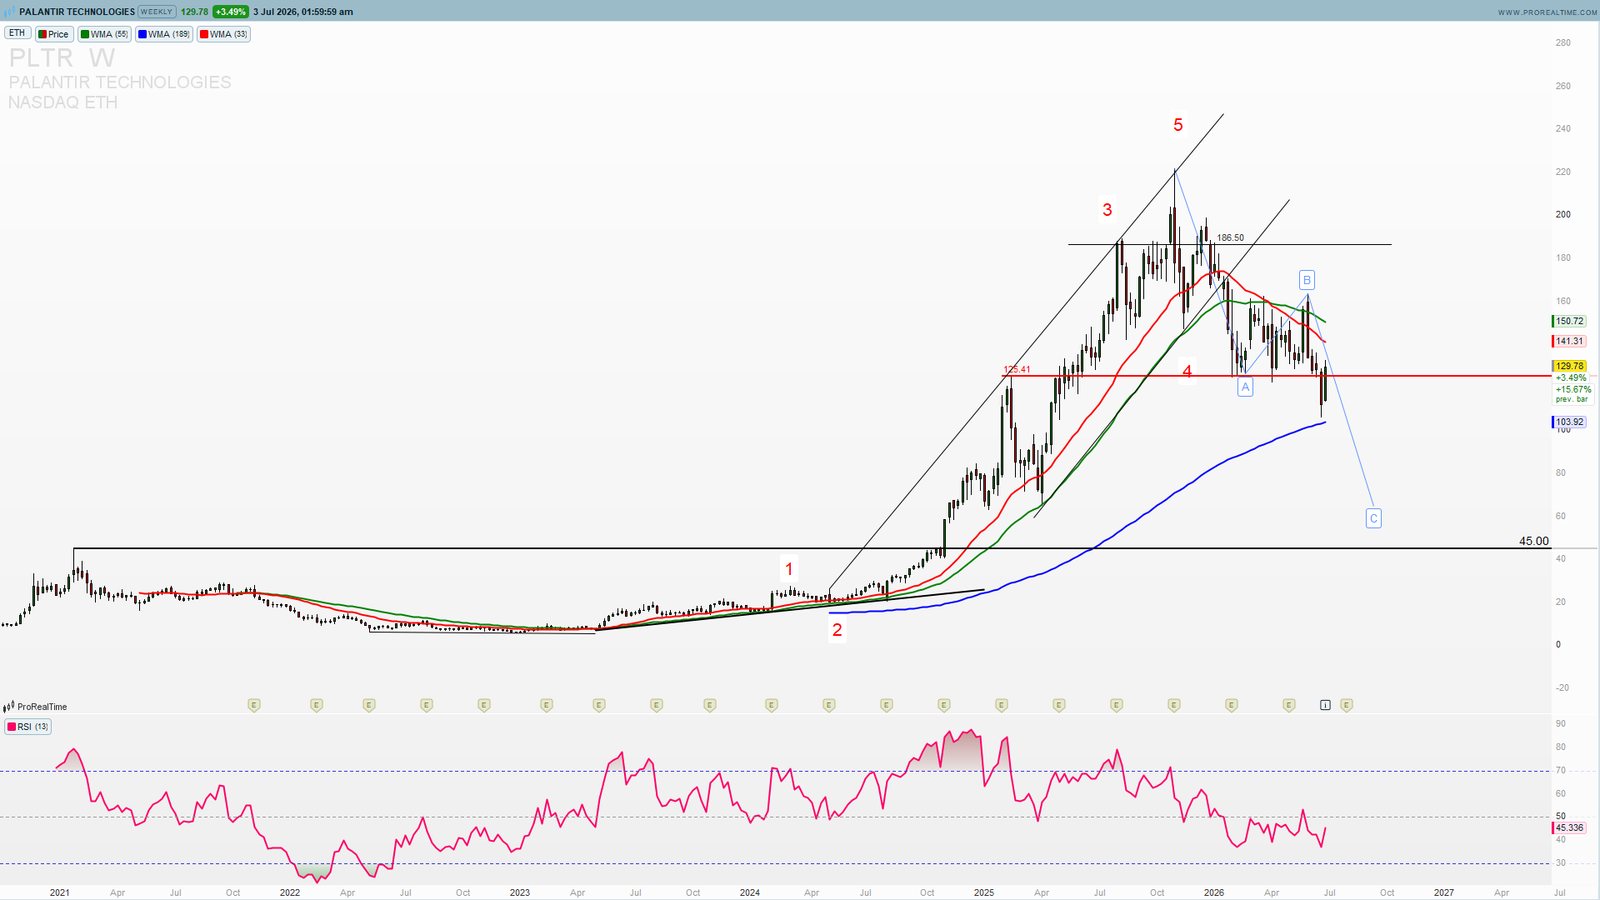
From late 2024 through mid-2025, PLTR traded within a well-defined rising parallel channel, with the upper boundary capping rallies and the lower boundary providing support. In Q3 2025, PLTR broke above the upper channel boundary in a blow-off move that took the stock to a year high of $187.28. That breakout has since fully reversed — PLTR has broken back below the lower channel boundary and is now using it as resistance rather than support.
$125.41 — The Key Support That Broke
The horizontal level at $125.41 was the most significant structural support on the weekly chart — a level that held through multiple tests across late 2024 and early 2025. PLTR has now broken below this level with a weekly close, retested it from below, and rejected. This is a textbook bearish retest — former support has turned into resistance. The current price of $129.78 sits just above this zone, and a weekly close below $125 would confirm the breakdown definitively.
Moving Averages — Bearish Configuration
PLTR is trading below its 50-week moving average (currently ~$143) and approaching its 200-week moving average (~$102). The 50W MA has crossed from support to resistance — every rally attempt has been sold into from that level. The RSI at 45.42 on the weekly is in neutral-to-bearish territory and has failed to recover above 50 following the breakdown from the highs.
Elliott Wave Structure — PLTR
The move from the 2024 lows to the $187 high counts cleanly as a 5-wave impulse — the classic Elliott Wave structure that precedes a full corrective retracement. PLTR is now in the early stages of an ABC correction. Wave A appears complete near the $106 low (year low), Wave B is the current bounce to $129–$143 resistance zone, and Wave C — the final and typically most aggressive leg — likely targets the $80–$90 zone, which coincides with the 2024 base and the 0.618 Fibonacci retracement of the entire 5-wave impulse from $9 to $187.
PLTR Key Levels and Downside Targets
🔴 BEARISH BELOW $125.41
A weekly close below $125.41 confirms the breakdown and opens the door to:
$106.37 — Year low and Wave A bottom. A break here eliminates the double-bottom scenario.
$91–$95 — 0.5 Fibonacci retracement zone and prior consolidation area from mid-2025.
$80–$85 — Primary Wave C target, 0.618 Fibonacci retracement, and the most likely destination if the corrective structure plays out in full.
🟢 BULLISH ABOVE $143
A weekly close above $143 (50W MA) would invalidate the bearish setup and signal:
The retest of $125 held as support and the corrective phase is over.
$155–$160 becomes the first recovery target.
A new leg toward the $187 high would be back on the table.
Current trading range levels:
$125.41 — Critical support / breakdown confirmation level
$129.78 — Current price (retest zone)
$143.13 — 50-week MA resistance
$155–$160 — Next significant resistance above
$102.93 — 200-week MA (major floor)
$80–$85 — Wave C primary target
MU Stock Analysis — Daily Chart Breakdown
Micron Technology’s daily chart shows a different but equally concerning technical picture — a stock in the late stages of a parabolic extension that has now broken its primary structural support.
The Parabolic Run and Broken Uptrend
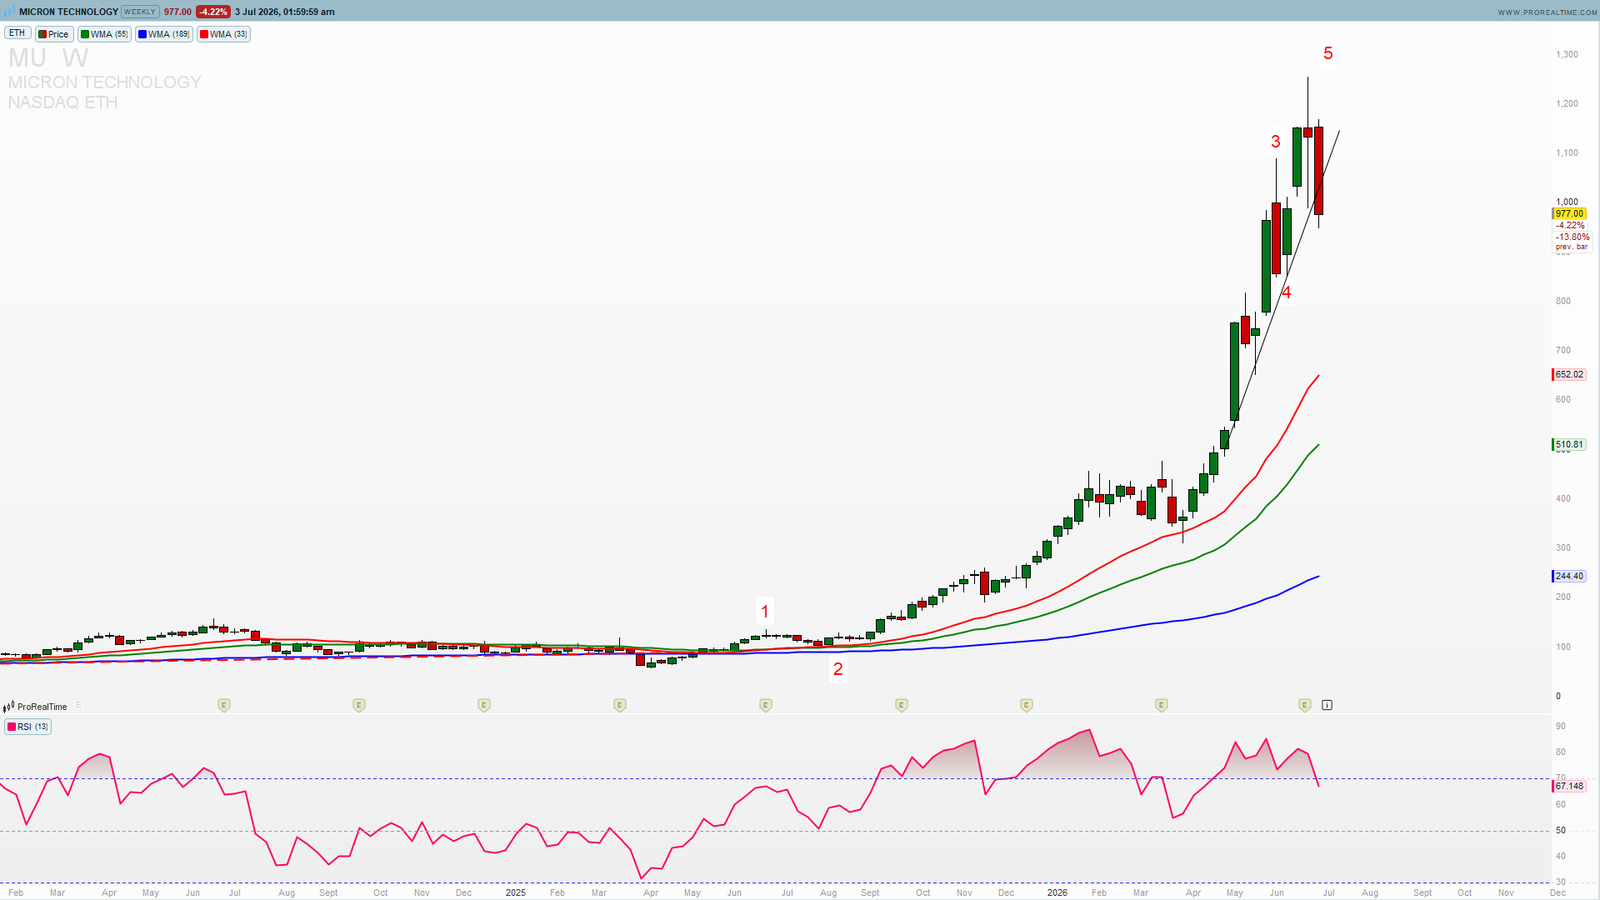
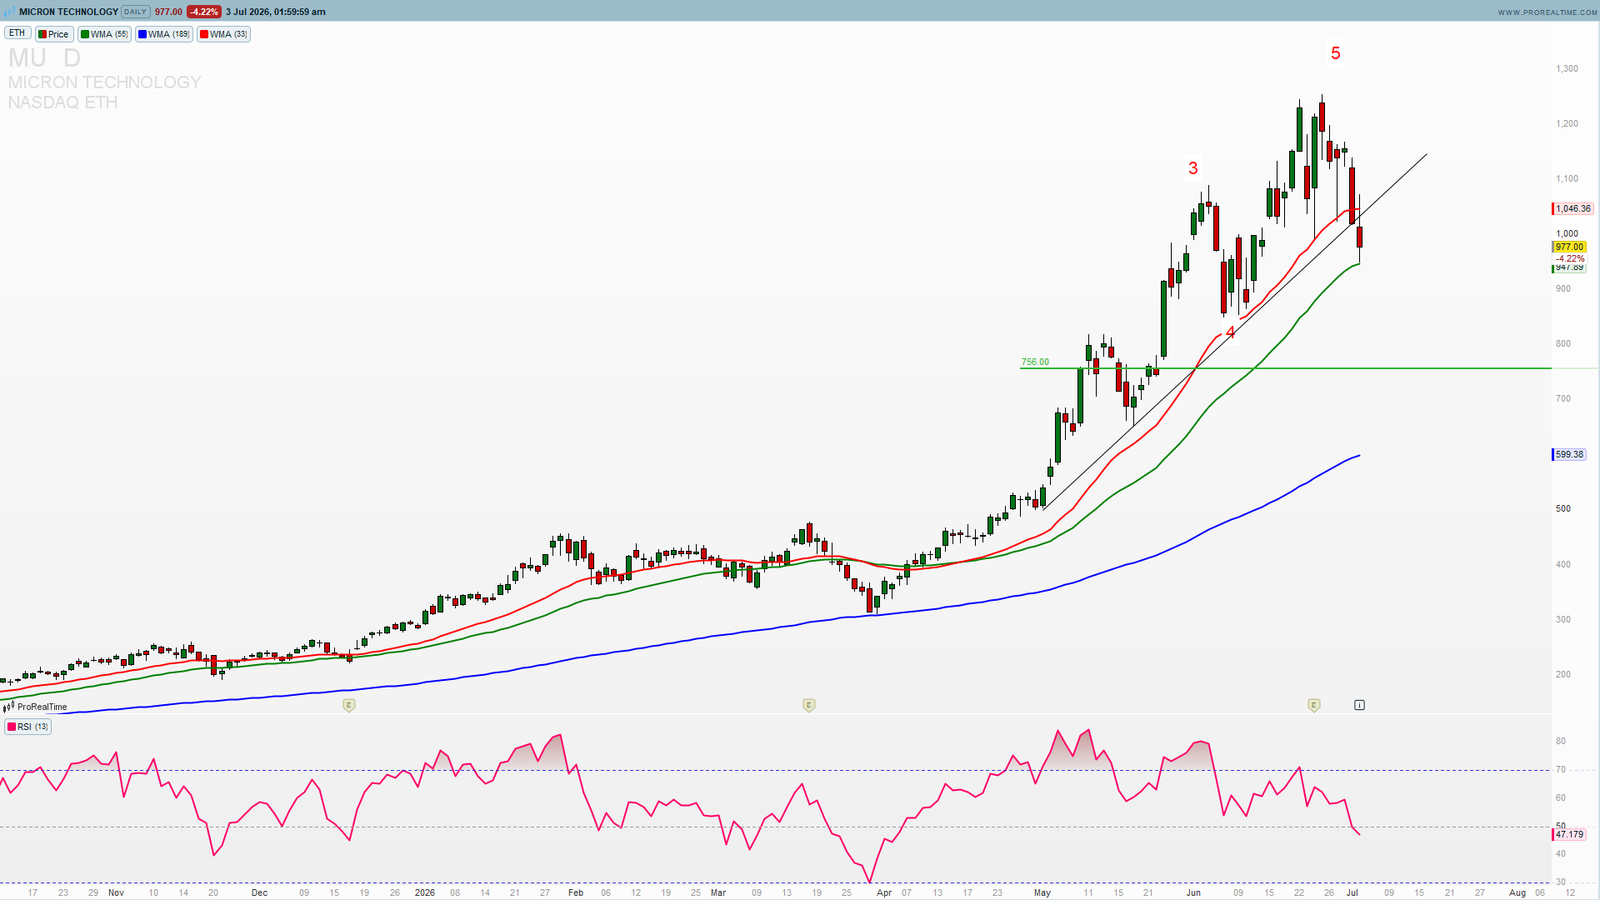
From the April 2026 lows near $309, MU staged one of the most aggressive parabolic moves seen in the large-cap tech space — a near 4x move from $309 to $1,255 in under three months. This type of parabolic extension, while impressive, is by definition unsustainable and always corrects. The uptrend line connecting the April and May swing lows — the line that defined the entire advance — has now been clearly broken on the daily chart. MU is currently at $977 and trading below the broken trendline.
Moving Averages — First Warning Signs
MU has broken below its 50-day moving average (~$993) for the first time during this entire advance. The 50 DMA provided support on every previous pullback — this break is the first structural signal that the trend has changed. The 100-day MA sits at $740 and the 200-day MA at $602 — both well below current price but acting as magnetic targets in a meaningful correction.
RSI Divergence — The Hidden Warning
While MU made new price highs above $1,200, the RSI failed to confirm — making a lower high. This classic bearish RSI divergence on the daily chart was the first technical warning that the parabolic move was losing momentum. The RSI is now at 48.06 — below the 50 level that separates bull and bear territory.
Elliott Wave Structure — MU
The move from $309 to $1,255 counts as a 5-wave impulse on the daily chart, consistent with the completion of a major wave. The current pullback below the trendline and 50 DMA represents the beginning of an ABC corrective structure. Wave A is in progress — the initial leg lower typically retraces to the 0.382–0.5 Fibonacci level of the entire move, which projects to $860–$780. If Wave C develops in full, the 0.618 retracement near $740 — which also coincides with the 100-day MA — becomes the primary target.
+ AMD & TSLA Included
✓ Full valuation multiples
✓ 6 data charts per report
✓ Bull & Bear case analysis
MU Key Levels and Downside Targets
🔴 BEARISH BELOW $950
A daily close below $950 — the most recent swing low and round number support — confirms the corrective structure is accelerating:
$860–$880 — 0.382 Fibonacci retracement of the $309–$1,255 move. First meaningful support.
$780–$800 — 0.5 Fibonacci retracement. Prior consolidation zone from May 2026.
$740 — 100-day MA and 0.618 Fibonacci retracement. Primary corrective target.
$602 — 200-day MA. Only reached in a deep correction scenario.
🟢 BULLISH ABOVE $1,050
A daily close back above $1,050 — above the broken trendline — would signal the breakdown is a false break:
$1,100–$1,150 becomes the first recovery target.
A retest of the $1,255 highs would be back in play.
Current key levels:
$1,255 — Year high / wave top
$1,050 — Broken trendline (now resistance)
$993 — 50-day MA (resistance)
$977 — Current price
$950 — Immediate support / breakdown confirmation
$860–$880 — 0.382 Fib target
$740.57 — 100-day MA / 0.618 Fib primary target
$602.39 — 200-day MA
Why Both Breakdowns Happening Simultaneously Matters
The simultaneous breakdown in PLTR and MU is not coincidental. Both stocks share a key characteristic — they were among the most aggressively bid momentum names of the 2025–2026 tech rally, with retail and institutional flows concentrated heavily into both tickers. When momentum reverses in these names, it tends to be sharp and extended because:
The same momentum buyers who drove prices higher are now sellers — and they tend to exit in waves rather than gradually.
Risk management systems at hedge funds and prop desks trigger stop-losses at similar technical levels, amplifying moves.
Both stocks carry significant options open interest near key levels — gamma exposure accelerates moves through those levels in either direction.
The technical picture mirrors the corrections seen in both stocks during 2024 and early 2025, where similar parabolic moves were followed by corrections of 40–60% before establishing new bases.
What to Watch This Week
PLTR — Weekly Close Below $125
The most important near-term signal for Palantir is the weekly close relative to $125.41. A close below this level on Friday confirms the breakdown. A close above $130 keeps the retest scenario alive.
MU — Daily Close Below $950
For Micron, the $950 level is the line. A daily close below here with volume would confirm Wave A is accelerating and $860 becomes the immediate target. Watch for any earnings pre-announcements or AI memory demand updates from major customers as potential catalysts.
Macro Context
Both PLTR and MU are sensitive to the broader AI trade narrative. Any negative development from major AI customers (Microsoft, Google, Amazon capex guidance) would act as an accelerant for the bearish moves. Conversely, any positive AI demand signal would be the fundamental catalyst to invalidate both setups.
—
PLTR and MU Bearish Outlook — Summary
PLTR Live Price — Investing.com
MU Live Price — Investing.com
Two of the most watched tech stocks are flashing simultaneous breakdown signals that historically precede extended corrections:
PLTR at $129.78:
🔴 Bearish below $125.41 — targets $106 → $91 → $80–$85
🟢 Invalidated above $143 (50W MA)
MU at $977:
🔴 Bearish below $950 — targets $860 → $780 → $740
🟢 Invalidated above $1,050 (broken trendline)
Both stocks completed 5-wave Elliott Wave impulse structures at their highs and are now in early-stage ABC corrections. The technical evidence favours further downside over the coming weeks — the only question is how deep the correction goes before new buyers step in.
Watch the weekly close for PLTR at $125 and the daily close for MU at $950. Those are the lines that decide everything.
Want precise entry levels, stop-loss placements, and Elliott Wave counts for PLTR, MU, and 50+ other stocks? Access ProSignalTrades Premium →
—
Disclaimer: This analysis is for educational purposes only and does not constitute financial advice. Trading involves significant risk. Always conduct your own research before making any investment decisions.