SPY is printing -1.04% today, trading at $735.93, and the daily chart tells a clear story: Wave C of a larger Wave 4 ABC correction is underway.
For anyone who has been watching the S&P 500 surge from the April lows, this pullback was not only expected — it’s structurally necessary before the final push to new highs.
In this post we walk through exactly what an ABC correction inside a Wave 4 means, how to read the current SPY chart using Elliott Wave and Price Action methodology, and the key levels that will define whether this is a healthy reset or the beginning of something more serious.
For macro context on risk assets right now, see our recent WTI Crude Oil Wave 3 analysis and our Gold XAUUSD breakdown.
The Big Picture — Where SPY Stands in the Elliott Wave Count
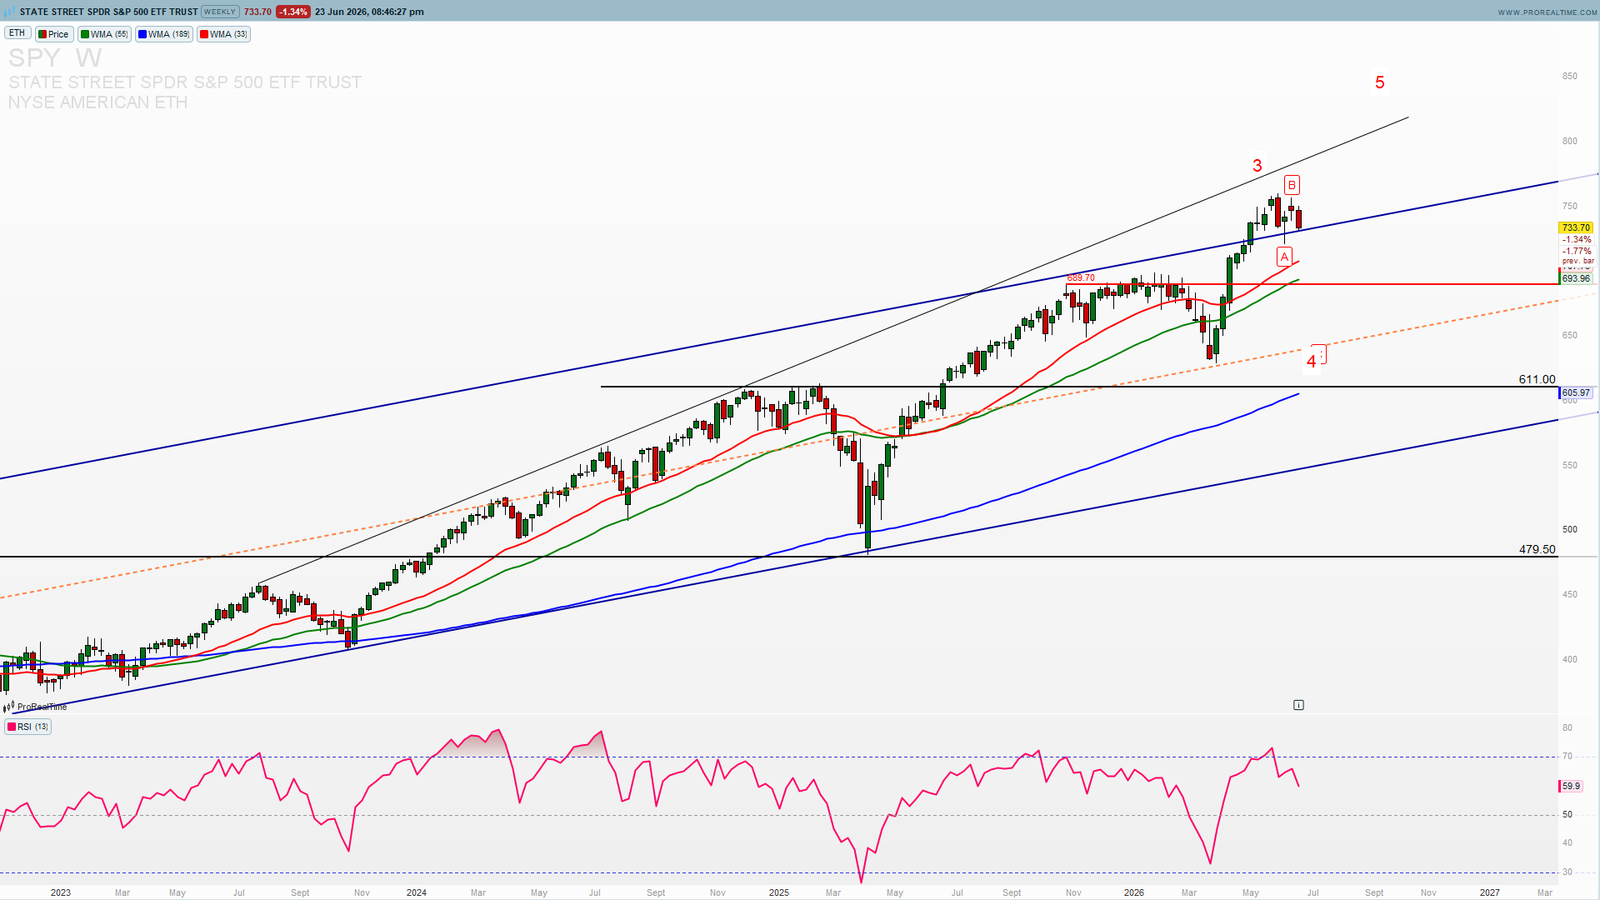
Elliott Wave Theory structures any trending market into five impulse waves: three in the direction of the primary trend (Waves 1, 3, 5) separated by two corrective waves (Waves 2 and 4).
Looking at the SPY daily chart from mid-2025 through today, the structure is remarkably clean:
Wave 1 — the initial recovery off the 2025 lows, establishing the new uptrend.
Wave 2 — a sharp corrective flush in early 2026 that brought price down to the $580–$600 zone, testing and holding the long-term rising channel.
Wave 3 — the powerful rally from April 2026 lows near $590 all the way to the recent highs above $770. Wave 3 was by far the strongest leg, as it almost always is.
Wave 4 (NOW) — the current pullback. A corrective phase that by rule cannot close below the Wave 1 high.
If this count is correct, after Wave 4 completes we should expect one final wave higher — Wave 5 — targeting the upper trendline channel in the $800+ area already projected on the chart.
Elliott Wave Education: What Is an ABC Correction?
One of the most powerful tools in Elliott Wave analysis is recognizing that corrections rarely move in a straight line. Instead, they typically unfold in three sub-waves labeled A, B, and C.
Understanding this structure helps traders avoid two common mistakes: selling into Wave A thinking the trend is over, or buying the Wave B bounce thinking the low is in.
Here is how the pattern works:
Wave A — the first leg down. Often sharp and feels like a trend reversal. Most market participants are caught off guard.
Wave B — a partial recovery bounce, frequently retracing 50–76.4% of Wave A. This is the trap for over-eager dip buyers. Price looks like it is recovering, but the corrective structure is not yet complete.
Wave C — the final and often most emotionally difficult leg of the correction. Wave C typically equals or exceeds Wave A in length. Crucially, this is also where the best structural buying opportunities appear.
In a Wave 4 context, the ABC pattern is especially important because Rule 4 in Elliott Wave theory gives traders a hard invalidation floor and a well-defined risk management level.
Reading the SPY Chart: Wave A, Wave B, Wave C in Progress
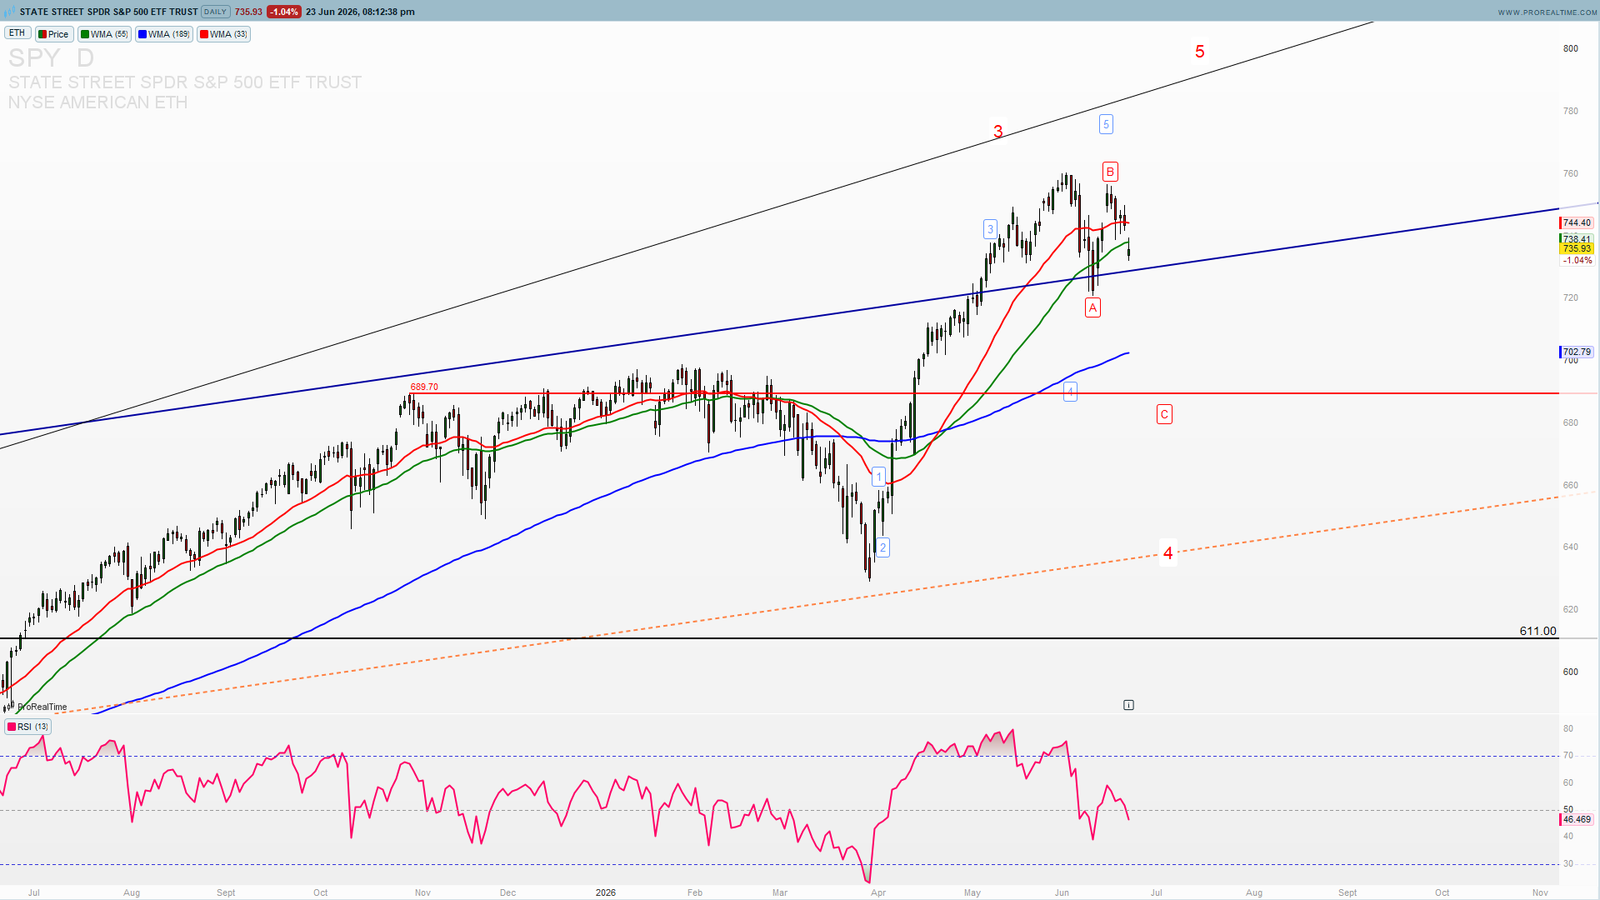
Applying this framework to the current SPY daily chart:
Wave A completed at the $718–$720 area after the sharp selloff from the $770+ high. The move was swift and caught most bulls by surprise.
Wave B bounced strongly back to approximately $760, recovering most of the Wave A decline — a textbook 76% retracement. This generated significant bullish media coverage and tempted buyers back in near the highs.
Wave C is now in progress. Price is at $735.93 and declining, with the RSI(13) at 46.47 and falling. Not yet oversold, which suggests this leg has more room to the downside before exhaustion sets in.
The moving average structure confirms the bearish near-term picture: the WMA(33) has rolled over and is now acting as resistance, while the WMA(55) is flattening. Price has slipped below both shorter-term averages.
The WMA(189) — the long-term trend anchor — remains far below at ~$700, pointing up and still supportive of the bigger bullish structure.
Key Support Levels for the Wave 4 Low
Based on the chart, here is the structural map for where Wave 4 could bottom:
$720–$722 — first meaningful support (Wave A low, coincides with rising blue channel lower boundary). A bounce here would be the most shallow Wave 4 resolution.
$689.70 — the major horizontal level marked on the chart in red, former resistance turned support. This aligns roughly with the 50% retracement of Wave 3 and is the level most Elliott Wave practitioners would target for a Wave 4 low.
$650–$640 zone — deeper Wave 4 target. This would represent a full 61.8% retracement of Wave 3 — uncommon but valid for a correction that precedes a strong Wave 5.
$611.00 — the absolute structural floor. A weekly close here would significantly damage the bullish count.
Bullish vs Bearish Triggers
✅ Close back above $744 → Wave C likely complete, Wave 4 finished, Wave 5 rally toward $800+ begins.
🟡 $720–$722 holding on a daily close → possible shallow Wave 4 low, watch for RSI divergence to confirm.
🔴 Break below $689.70 → deeper Wave 4 in play, $650–$640 area next.
🛑 Invalidation: sustained weekly close below $611 → Wave 4 has breached Wave 1 territory, bullish count broken.
Want live SPY Elliott Wave counts, precise entry/exit levels, and real-time trade signals? Access ProSignalTrades Premium → Use code FIFA30 for 30% off Lifetime plus a shot at a funded account.
What Could Drive Wave C Lower — Macro Catalysts
Wave C corrections need a narrative to materialize, and there is no shortage of catalysts right now.
Federal Reserve policy path — any revision to the rate cut timeline or a more hawkish tone in upcoming Fed communications could accelerate the selloff. The market is currently pricing 1–2 cuts by year-end.
Q2 earnings season — beginning in mid-July, guidance from megacap tech will be the critical test. Any miss from NVDA, MSFT, or AAPL could deepen Wave C quickly.
Geopolitical risk — our WTI analysis flagged that the Hormuz situation is not fully resolved. An oil price spike from a breakdown in US-Iran negotiations would pressure both consumer spending and risk assets simultaneously.
USD strength — a stronger dollar, particularly if driven by safe-haven demand, historically correlates with S&P 500 weakness at key structural levels.
For live SPY data, Yahoo Finance SPY page is a reliable free resource. For the broader S&P 500 composition and sector weights, see State Street’s official SPY fund page.
SPY Outlook — Dangerous Near-Term, Powerful Wave 5 Setup Ahead
The near-term picture is clear: Wave C is in progress, RSI is falling, and the moving averages confirm deteriorating short-term momentum.
A move toward $689.70 is the base case for Wave 4 completion. The $650–$640 zone remains a deeper but valid alternative.
The medium-term picture, however, remains constructive. Wave 4 corrections inside a 5-wave structure are not trend reversals — they are resets that build the energy for Wave 5. As long as SPY holds above the $611 structural floor, the bullish count targeting $800+ remains fully intact.
The trader’s job right now: don’t fight Wave C on the way down. Watch for RSI divergence and a structural support reaction that signals Wave 4 is done — because that is when Wave 5 offers one of the clearest risk/reward setups in trend analysis.
Access ProSignalTrades Premium for real-time SPY wave counts, trade levels, and multi-asset signals. Get started here →
—
Disclaimer: This analysis is for educational purposes only and does not constitute financial advice. Trading ETFs and equities involves risk of loss. Always conduct your own research before making any trading decisions.