For related setups, also read our Oil Breakout Analysis and our Bitcoin Bearish Setup.
The Nasdaq 100 forecast is bullish while price holds above its rising structure. NQ is trading at 30,889.25, up 0.40%, pressing directly against the horizontal resistance that has capped every attempt since the July highs. Above it, the upper boundary of the long-term ascending channel sits near 34,000 — and that is where a confirmed breakout points.
This is a continuation setup, not a reversal call. The weekly structure has been intact since the March lows near 23,550, and the recent consolidation looks like a pause inside the trend rather than a top forming.
Nasdaq 100 Forecast — Pressing the Range High
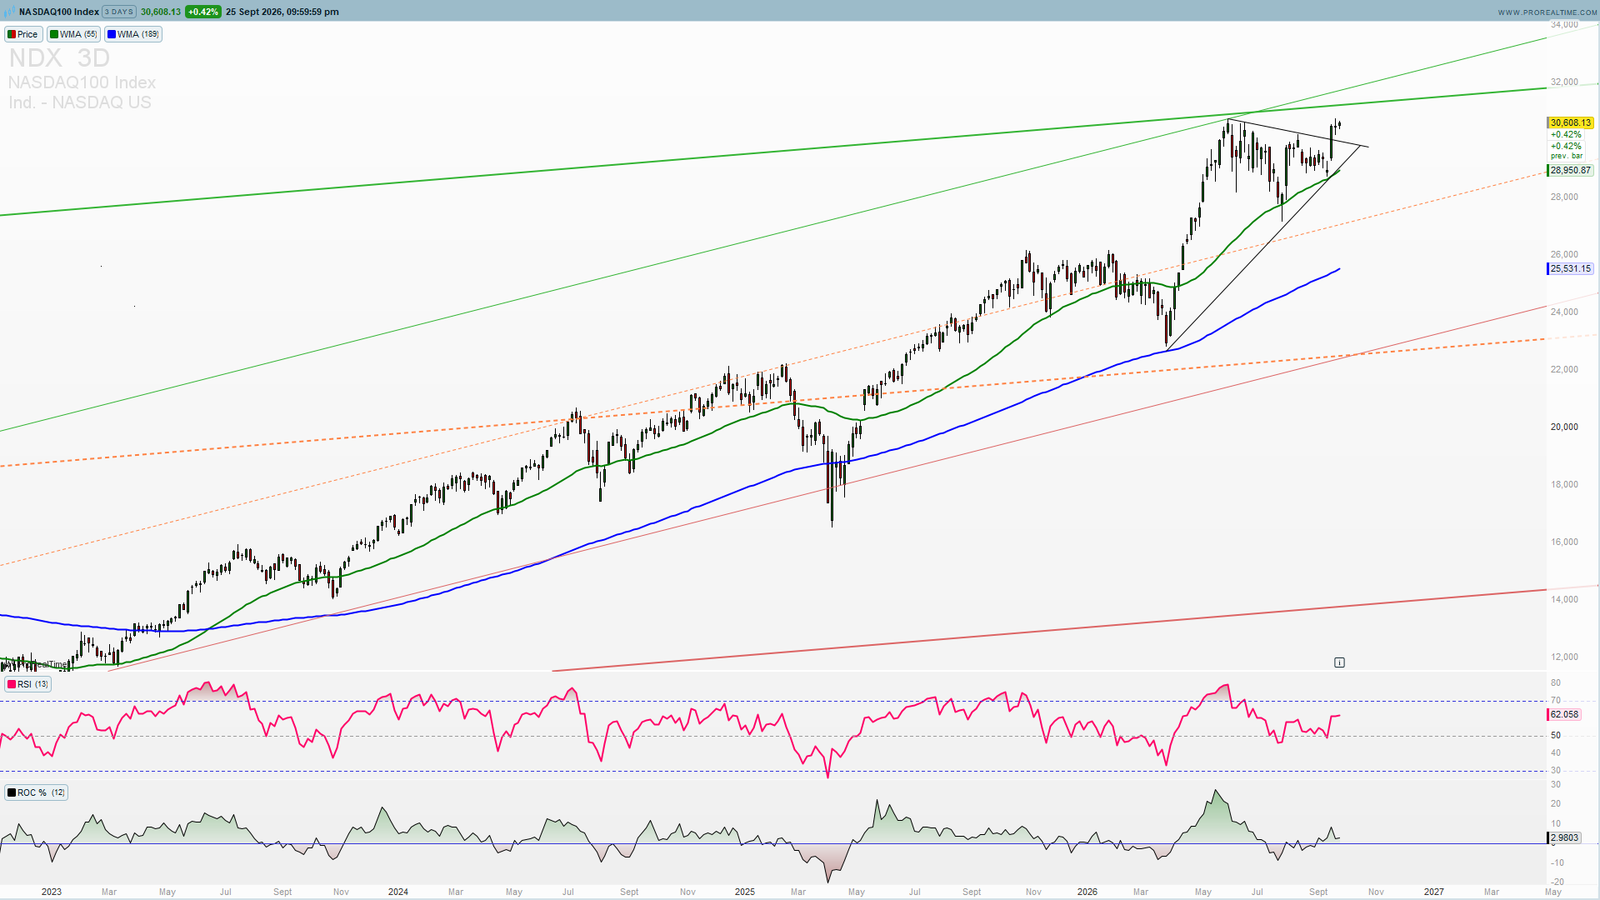
The weekly chart shows NQ advancing in a well-defined ascending channel that has contained price for the entire cycle. After the powerful rally off the March low at 23,550.25, the index pushed to a year high of 31,396.50 before entering a multi-week consolidation between roughly 29,000 and 31,000.
The Consolidation Held Above Support
What matters about that pullback is where it stopped. Price never broke back below the WMA(33) at 28,672.19, and the dotted ascending support line running beneath the range was respected on every test. Corrections that hold their structure like this typically resolve in the direction of the prevailing trend.
Momentum Is Constructive, Not Extended
The RSI reads 62.21 — above the midline and rising, confirming buyers are in control, but well short of the overbought extremes that usually precede a meaningful top. That leaves room for the move to extend rather than exhaust immediately.
Every Moving Average Sits Below Price
The WMA(33) at 28,672, the longer average at 26,352 and the structural support at 24,483 are all beneath current price and sloping higher. In a trending market this is the definition of a healthy advance — and it means the first line of defence on any pullback is a long way below the current range.
NQ Key Levels — What a Break Above 30,889 Opens
The structure is straightforward: a rising channel, a horizontal ceiling being tested, and a clearly defined upside objective if that ceiling gives way.
Immediate Resistance: 30,889 – 31,396
The horizontal level price is pressing against, with the year high just above it. A weekly close above this band is what turns the consolidation into a confirmed breakout.
Primary Target: 34,000
The upper boundary of the long-term ascending channel. This is where the trend structure itself says the next major test lies, and it is the logical objective for a continuation from here.
First Support: 28,672
The WMA(33). A pullback that holds this level keeps the bullish structure fully intact and would represent a higher-probability entry than chasing the range high.
Structural Support: 26,352 → 24,483
The longer-term averages and the rising channel support. Only a decisive break below this zone would invalidate the broader uptrend.
Why This Setup Reads Bullish
Consolidation Below Resistance Usually Resolves Higher
When price spends weeks grinding sideways directly beneath a level rather than rolling over away from it, sellers are absorbing supply without gaining ground. Repeated tests tend to weaken a ceiling, not strengthen it — and NQ has now tested this one several times without breaking down.
Macro Context
The index is advancing against a backdrop where rate expectations and AI-driven earnings remain the dominant variables. As one market overview notes, potential Fed rate cuts could reduce the discount rate applied to future tech earnings while AI monetisation supports higher multiples — with heavy AI capital expenditure and regulatory scrutiny cited as the main offsetting risks. Traders can follow live Nasdaq 100 price action on FXStreet for real-time confirmation.
What to Watch This Week
The 30,889 Weekly Close
Everything hinges on whether NQ can close a weekly candle above the range high. That is the signal that the consolidation has resolved upward and the channel top comes into play.
Confirmation Requires Follow-Through
A single push above resistance is not enough — intraweek spikes above this level have already been sold once. A close above 31,396 with expanding range is what confirms the breakout rather than another failed test.
NQ Summary
Nasdaq 100 at 30,889.25:
🟢 Bullish above 28,672 — a breakout through 31,396 targets the channel top near 34,000
⚠️ Neutral between 28,672 and 30,889 — range-bound consolidation, no directional edge
🔴 Invalidated on a weekly close below 26,352 — that would break the rising structure and shift the outlook
The Nasdaq 100 is pressing resistance from a position of strength: every moving average below price and rising, RSI constructive without being stretched, and a consolidation that held its support throughout. The structure now rests on a single level. Above 31,396 the long-term channel top near 34,000 becomes the objective; below 28,672 the range simply extends.
Track NQ and every major index, pair and metal in real time — live charts, Elliott Wave structure, automated scanners and institutional research on one platform with the PST All-Access plan, backed by a 30-day money back guarantee.
—
Disclaimer: This analysis is for educational purposes only and does not constitute financial advice. Trading involves significant risk. Always conduct your own research before making any investment decisions.