For related setups, also read our Gold Bearish Setup and our Oil Breakout Analysis.
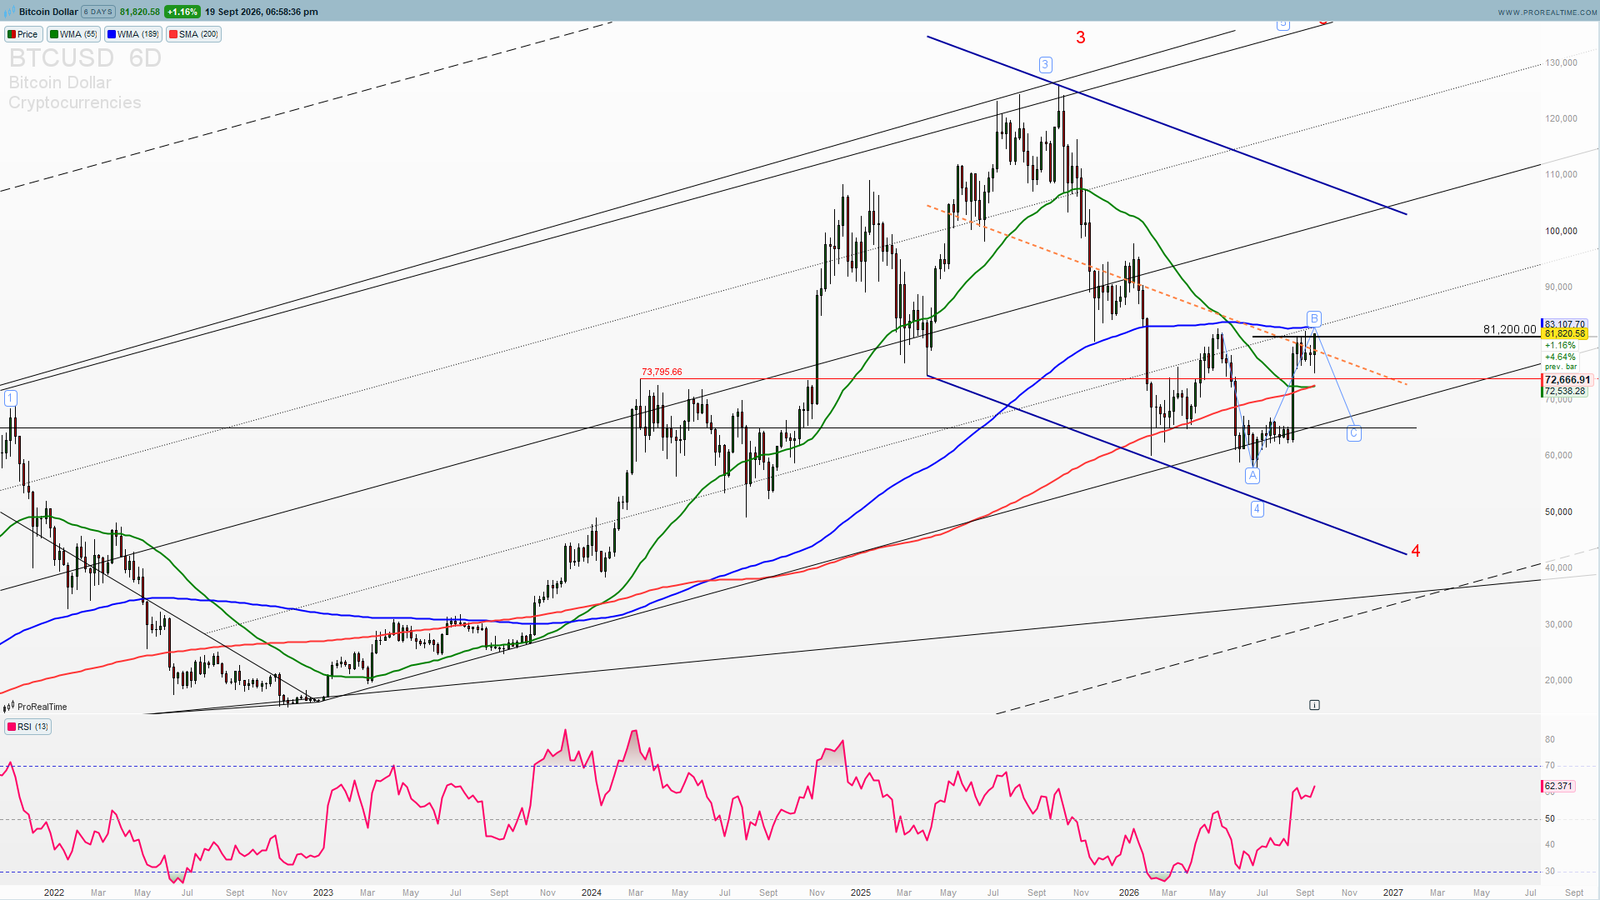
The Bitcoin bearish setup is a correction inside an uptrend, not a top. BTCUSD is trading at $81,820.58, up 1.16%, after a sharp recovery off the $62,000 area. But that recovery is running directly into $83,107.70 — and the wave structure argues this is a B wave stalling at resistance, not the start of a new leg to new highs.
The level that matters from here is $83,107.70. Failure there sets up a C leg lower toward the $72,666 zone. That would complete the correction and, importantly, set the stage for the larger advance to resume — which is why this is a setup to trade, not a reason to abandon the bullish structure.
Bitcoin Bearish Setup — The B Wave Is Stalling at Resistance
The 6-day chart shows Bitcoin working through a corrective wave 4 following the impulsive wave 3 advance that topped near $130,000. Within that correction, the A leg bottomed around $62,000, and price has since rallied in what counts cleanly as a B wave — the countertrend bounce that typically traps traders into believing the correction is finished.
Resistance Is Layered, Not Single
Price is pressing into $83,107.70 with the WMA(189) sitting almost exactly at that level, and the descending orange trendline from the wave 3 top converging into the same zone. Three separate forms of resistance meeting at one price is not a level that gives way on the first attempt.
RSI at 62 Shows Strength Without Confirmation
The RSI(13) reads 62.37 — a strong recovery from the sub-30 readings at the A wave low, but well short of the 70+ levels that accompanied the genuine impulsive advances in this cycle. Countertrend rallies frequently produce exactly this profile: real momentum, no confirmation.
Price Is Still Below the 200 SMA
The SMA(200) at $72,538.28 has flipped from support to a reference the market is trading above but has not decisively re-established. Until Bitcoin proves it can hold this recovery on a retest, the corrective read remains the higher-probability structure.
BTCUSD Key Levels — What a Break Below $73,795 Opens
The confluence is straightforward: a B wave into layered resistance, momentum that never confirmed, and a defined target zone below where the correction would complete.
Critical Resistance: $83,107.70
This is the entire thesis. A decisive close above it — and above the descending trendline from the wave 3 high — would invalidate the C-wave count and suggest the correction ended at the A low.
First Support: $73,795.66
The horizontal level that capped the prior range. This is the first genuine test on any decline and the gateway to the deeper target.
C Wave Target: $72,666.91
The confluence zone where the SMA(200) at $72,538 and the prior structural support converge. This is where a textbook C leg would complete and where buyers should be expected to step back in.
Deeper Support: $62,000
The A wave low. Only a break below this level would break the corrective structure entirely and force a rethink of the bullish continuation case.
Why This Setup Reads Bearish — For Now
B Waves Are Designed to Look Like Breakouts
The defining characteristic of a B wave is that it is convincing. It recovers a large portion of the A leg, it reclaims moving averages, and it generates exactly the kind of bullish commentary now appearing around Bitcoin. The tell is not the strength of the rally but where it stops — and this one is stopping at a wall of confluent resistance without clearing it.
The Macro Bid Is Real, Which Is Why This Is a Correction and Not a Top
Institutional demand remains structurally supportive: U.S. spot Bitcoin ETFs recorded roughly $731 million in net inflows on September 3, 2026 — their strongest single day since January, with BlackRock’s IBIT leading. That underlying bid is precisely why the base case here is a C leg into support rather than a cycle top. Traders can follow live BTC price action on CoinDesk for real-time confirmation.
What to Watch This Week
The $83,107 Reaction
Everything hinges on this zone. Rejection and a close back below the recent range keeps the C-wave path open toward $73,795 and then $72,666. A decisive close above invalidates it.
Confirmation Requires Follow-Through
A single rejection candle at $83,107 is a signal; losing the recent consolidation lows with expanding range is confirmation. Until that happens, this is a B wave at resistance rather than a completed reversal.
BTCUSD Summary
Bitcoin at $81,820.58:
🔴 Bearish below $83,107.70 — C wave targets $73,795, then $72,666
⚠️ Neutral between $73,795 and $83,107 — corrective chop, no directional edge
🟢 Invalidated on a confirmed close above $83,107.70 — that would end the correction early and reopen the path toward the prior highs
Bitcoin’s recovery is real but incomplete. The B wave has carried price into a zone where the WMA(189), horizontal resistance and the descending trendline from the wave 3 top all converge, with RSI strong but unconfirmed. The structure now rests on a single level. Below $83,107 the C leg toward $72,666 stays live — and that decline, if it comes, is the setup that precedes continuation higher, not the end of the trend.
Track BTCUSD and every major pair, index and metal in real time — live charts, Elliott Wave structure, and market bias on one screen with PST Terminal, included with the PST All-Access plan.
—
Disclaimer: This analysis is for educational purposes only and does not constitute financial advice. Trading involves significant risk. Always conduct your own research before making any investment decisions.