NVIDIA’s Five-Year Financial Transformation: From Chipmaker to AI Juggernaut
The numbers don’t lie — NVIDIA’s financial trajectory over the past five years is one of the most dramatic in corporate history. A company that generated $16.7 billion in revenue in fiscal 2021 closed fiscal 2025 with $130.5 billion, nearly an eightfold increase in just four years.
Revenue and Profitability
Revenue growth accelerated sharply, jumping from $26.9 billion in FY2023 to $60.9 billion in FY2024 and then more than doubling again to $130.5 billion in FY2025 — largely driven by explosive demand for AI chips. What’s even more striking is the quality of those earnings. NVIDIA’s gross profit margin reached 75.5% in FY2025, up from 59.5% in FY2023, reflecting its dominant pricing power. Net income of $72.9 billion represented a net margin of 55.9% — meaning more than half of every dollar of revenue flows through to the bottom line.
Cash Flow and Free Cash Flow
Operating cash flow hit $64.1 billion in FY2025, up from just $5.6 billion two years prior. Free cash flow after dividends reached $60 billion, giving NVIDIA enormous flexibility for buybacks, R&D, or strategic investments. Capital expenditure remains relatively modest at $3.2 billion, underlining how asset-light the business model is.
Balance Sheet Strength
Total assets grew to $111.6 billion in FY2025, while total debt fell to $8.5 billion — giving NVIDIA an interest coverage ratio of over 332x. Common equity stands at $79.3 billion. The company is essentially debt-free in any meaningful sense, with cash and short-term investments of $43.2 billion.
Returns and Valuation
Return on equity hit 119% in FY2025, and return on invested capital reached 104% — both extraordinary figures that reflect just how efficiently NVIDIA turns capital into profit. The market clearly agrees: market capitalization reached $3.49 trillion by January 2025, up from $321 billion in FY2021 — a more than 10x increase in enterprise value.
Efficiency
Revenue per employee reached nearly $4 million in FY2025, while net income per employee exceeded $2.2 million — metrics that put NVIDIA in rarefied company among the world’s most productive businesses.
In short, NVIDIA’s five-year financials tell the story of a company that caught the AI wave early and rode it to the top. The question now is whether these margins and growth rates are sustainable — or whether competition and infrastructure build-out costs will eventually compress them.
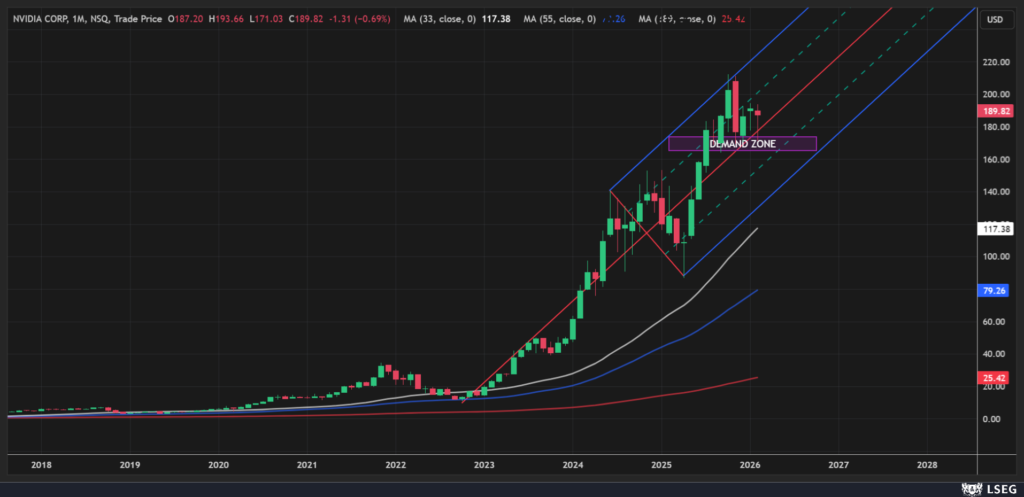
NVDA bounce from the support
NVDA pulled back and bounced from the demand zone and a strong support 170. It is the middle of a Pitchfork channel and the most important support for an extension higher and the attack on 230.
Distribution time is over
NVDA is stuck in a 170-190 range for 13 weeks already and it is about time to see an explosive move which will determine direction for the next weeks and months for sure. NVDA did not lost demand from institutional and retail investors and is attracting more. Decreased volume means that there is no more space for short trades to gain traction.
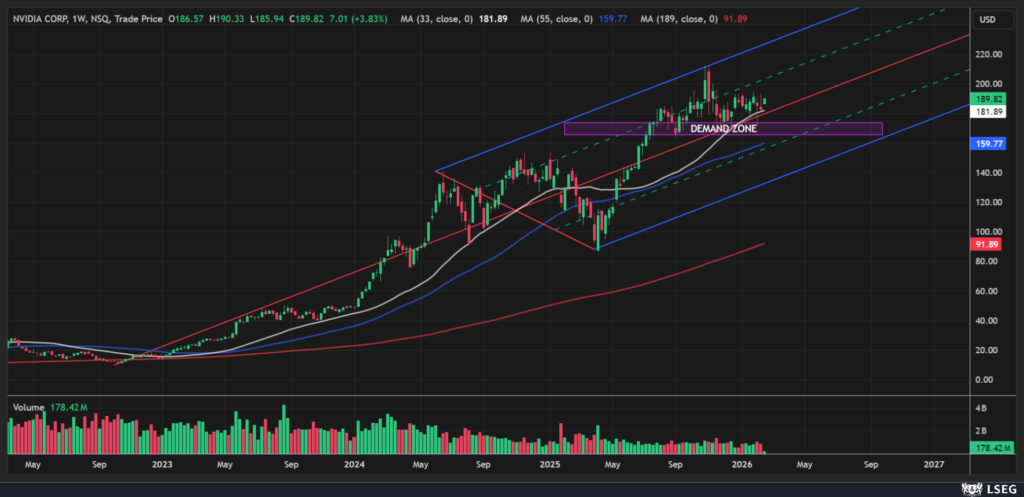
On the weekly chart you can triangle formed (join to get premium analysis, weekly and mid-week newsletter and other tools for for your successful trading 30% discount) above the demand zone. A break above 194 and a weekly close above this level is needed for an extension higher to 230.
Trade this setup with my preferred broker 👇
On a daily chart it is visible that the volume is rising and a pressure on 193 level break is increasing. To continue higher price should not fall bellow 175.
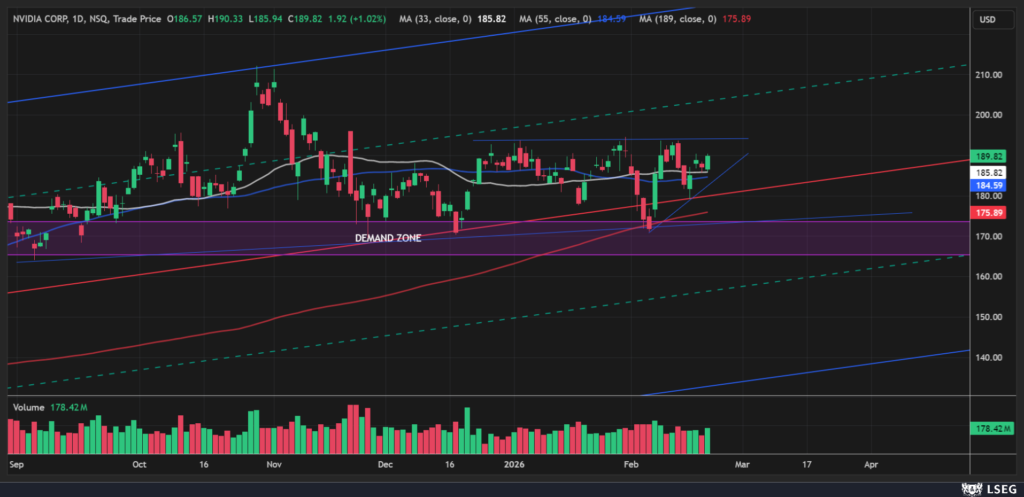
This is my favourite trading setup with a good RR, clear structure supported by the overall market moves and fundamental data. NVDA is open to reaching a new high.

Trade safe!