Bitcoin major pullback is leaving the uptrend intact
Major Price Volatility & Market Downturn
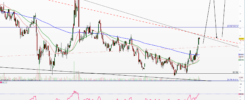
Bitcoin reached the channel bottom
Somewhere during the middle of the year 2024 I have identified this long-term uptrend channel. In October 2024 I gave a bold prediction of Bitcoin upside target 100k to be reached soon. Everyone were considering me crazy then taking into account Bitcoin long years of consolidation. Recently price action gave us full retracement of the channel from a top to recent bottom of 60000 exactly. From there we have a great bounce higher ongoing with a first visible resistance of 74000.
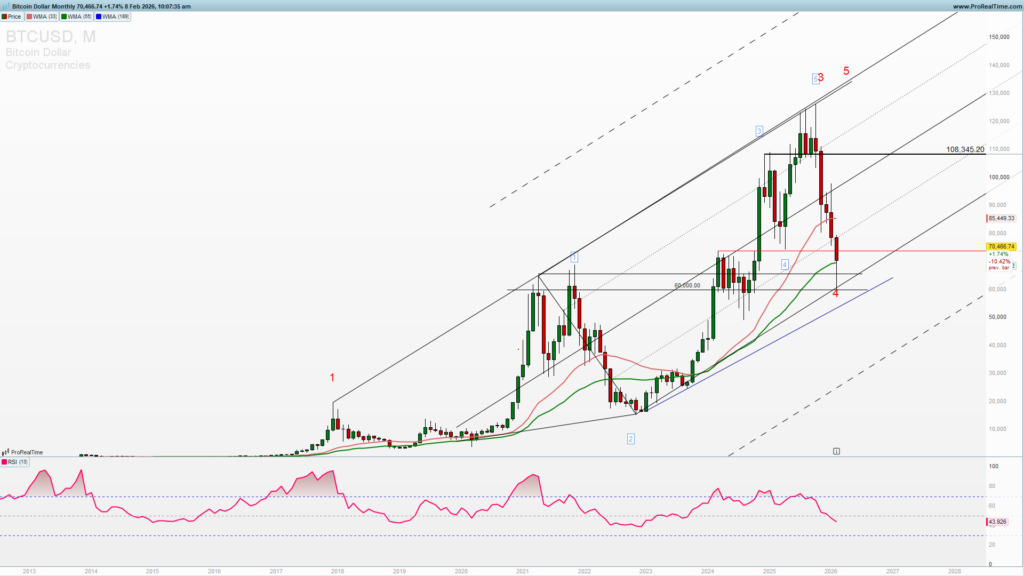
Bitcoin 61.8% retracement
Bitcoin retraced more then 61.8% if the Fibonacci upside from September 2023 to October2025. This is a sharp reversal during 5 months which is giving an excellent risk to reward buying opportunity for both short-term traders and long-term investment holders. Gold is now much overpriced and its upside extension for this year is fairly limited and will be extremely volatile, much more then Bitcoin for sure. And they call crypto volatile asset.
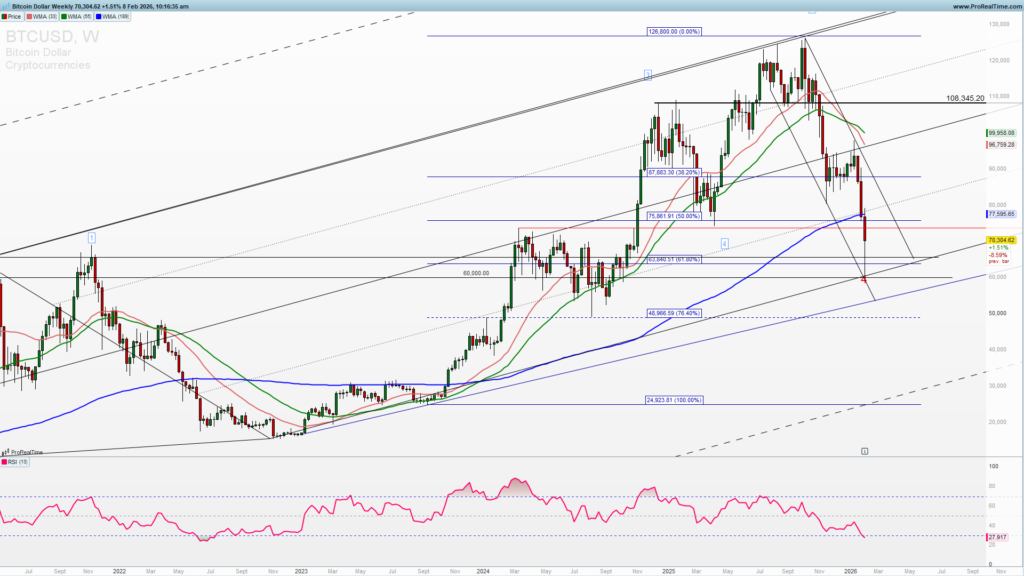
On the weekly chart you can see a strong cluster of the support (join to get premium analysis, weekly and mid-week newsletter and other tools for for your successful trading) indicated on the long-term chart. You can see also declining channel which is at its peak and we can see a turn higher as a great opportunity with low risk.
Trade this setup with my preferred broker 👇
Friday bounce does not excluding one more test of 63000-65000 zone but a probability for that is getting lower as demand is increasing and we did not have sharp move below 65000 during the weekend. So get ready for a nice upside ride to 75550 and beyond with a declining channel resistance standing now at 88000.
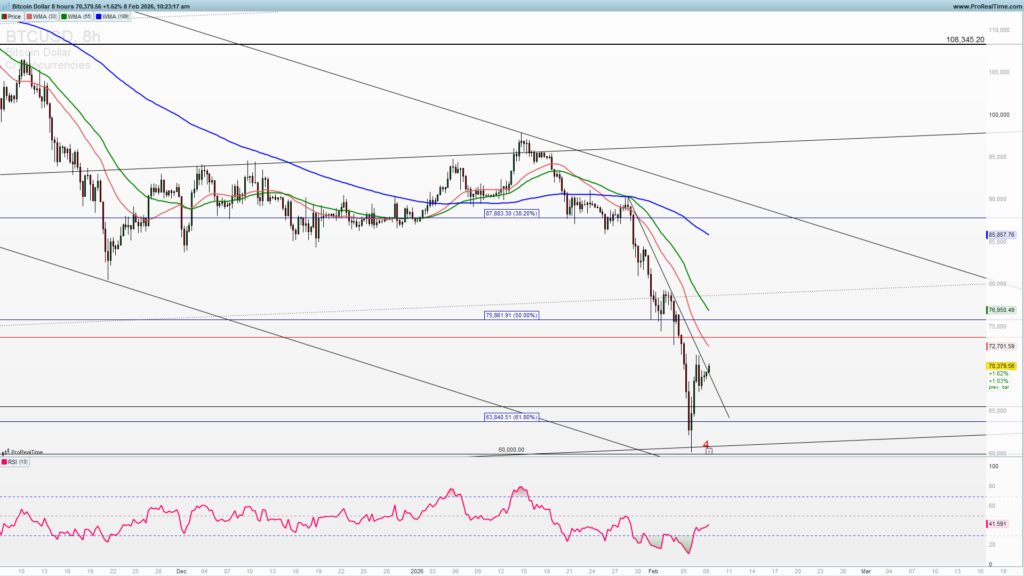
You can use the possible pullback early next week for a buying opportunity or a stable price action above 70000 for a buy stop entry.
Trade safe!