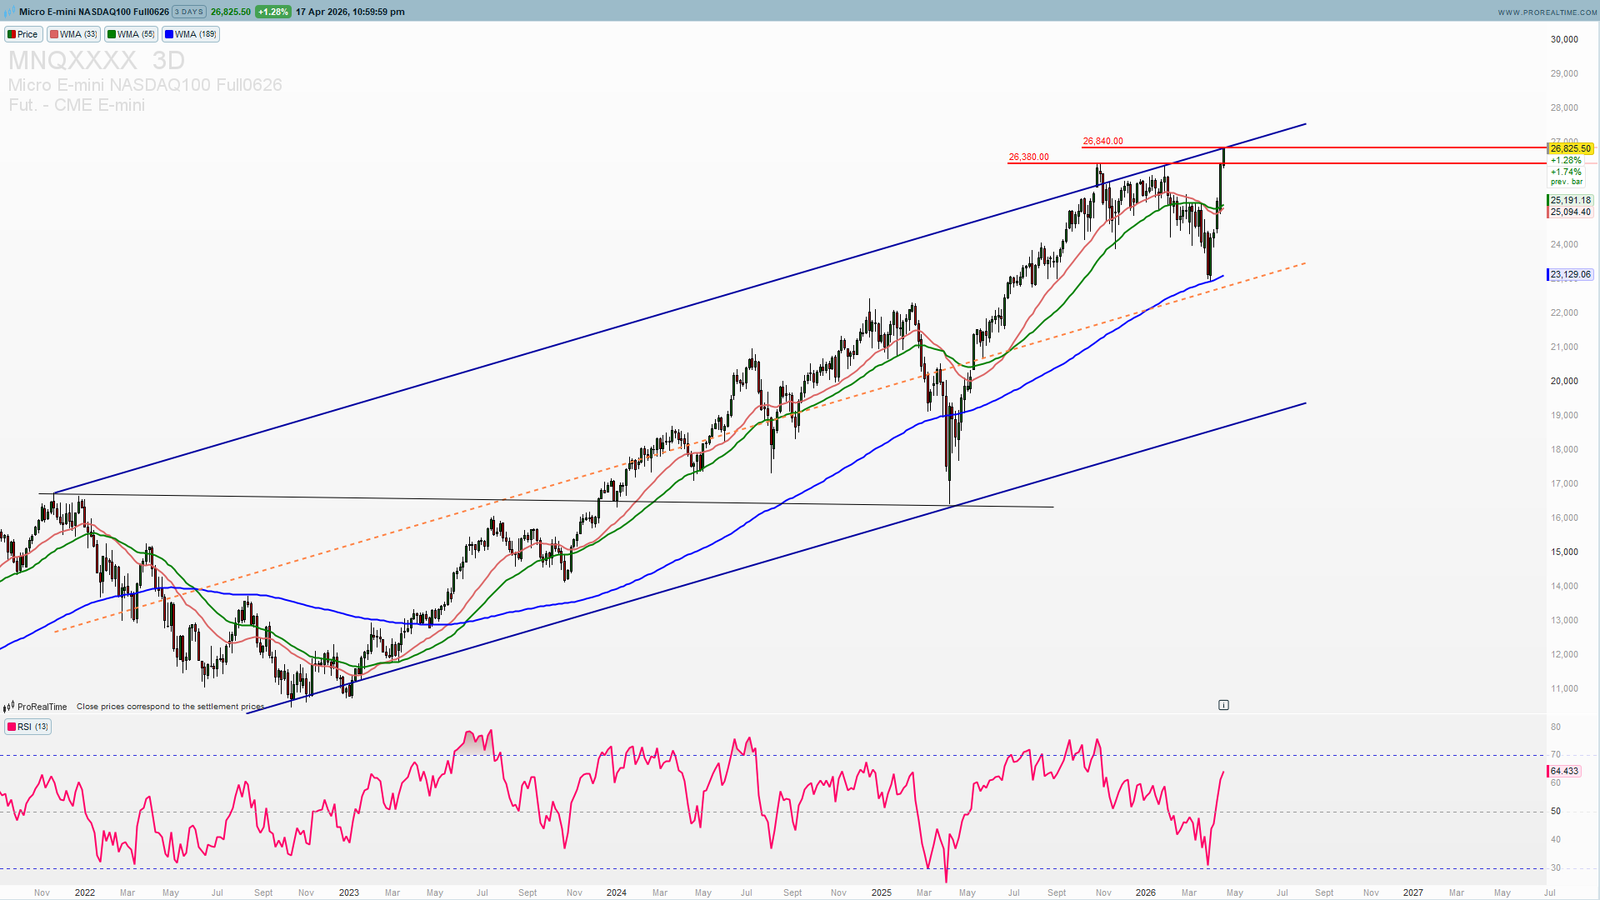
The Nasdaq 100 has staged one of its most aggressive recoveries in recent memory. From the March 2026 low near 22,919, NAS100 Futures have rallied nearly 3,900 points in just over two weeks — a near-vertical move driven by geopolitical relief as US-Iran ceasefire talks generated optimism across risk assets, pushing technology stocks sharply higher.
Now, with NAS100 Futures trading above 26,000 and approaching the all-time high resistance zone near 26,296, the critical question is: does the rally continue from here, or is a pullback overdue before the next leg to 27,000?
E-mini Nasdaq-100 Futures — CME Group
Live NAS100 Futures price — Investing.com
Our analysis points to one clear answer — the risk/reward for bulls at current levels is poor, and smart money will wait for a pullback before positioning for the extension higher.
For broader market context, also read our SPY S&P 500 Analysis and Gold XAU/USD Analysis.
NAS100 Futures — Current Market Structure
The rally from the March low has been impressive but concerning from a technical standpoint. A near-vertical move of 3,900 points in 2.5 weeks, with no meaningful consolidation, leaves the market structurally vulnerable to a sharp pullback.
Here is the key problem for bulls buying at 26,000+:
The all-time high resistance sits at 26,380 — a level that capped price in early 2026 before the sharp correction began. Breaking through ATH resistance after a near-vertical rally, without any consolidation or base building, is a low-probability trade setup. The risk/reward simply does not favour new long positions at these levels.
Meanwhile, a measured pullback to the 24,954–25,442 zone would reset the technical structure, shake out weak longs, and create a far more attractive entry point for the next extension toward 27,000 and beyond.
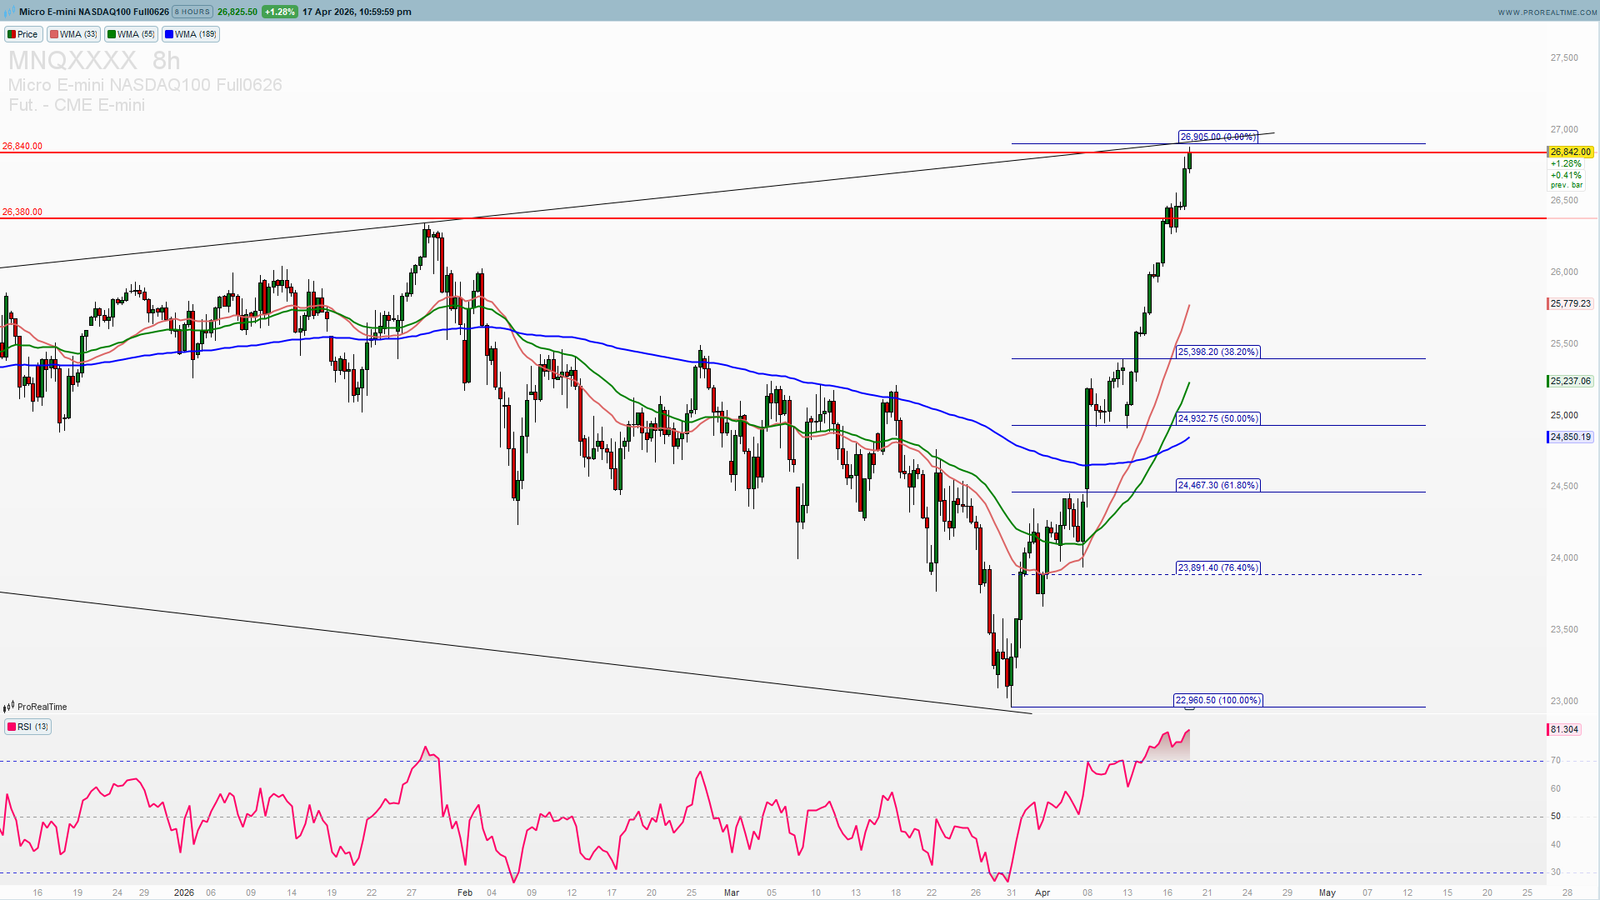
Key Fibonacci Levels and Technical Structure
Looking at the weekly NAS100 chart, the Fibonacci retracement levels from the all-time high to the March correction low provide a clear roadmap:
26,840 — All-Time High / ATH Resistance (0.0%)
The ultimate resistance level. A weekly close above this zone with strong volume would confirm the bull market is fully intact and open the door to 27,000+. Without that confirmed breakout, this level acts as a ceiling.
25,882 — Near-Term Resistance
The first major resistance below ATH. Price needs to consolidate above this level before any sustainable move higher is credible.
25,442 — Pullback Target Zone (Upper)
This level represents the upper boundary of our preferred pullback zone. A retest of this area would be entirely healthy within the context of the larger uptrend.
24,954 — Pullback Target Zone (Lower / Key Support)
This is the most important near-term support level and the ideal entry zone for the next long position. A pullback to 24,954 would represent approximately a 7% retracement from the ATH — well within normal corrective behaviour in a bull market.
24,539 — Secondary Support
A deeper pullback could reach this level, which still sits above the key structural support at 22,919.
23,940 — 23.6% Fibonacci Retracement
The 23.6% Fibonacci level. A move here would represent more significant selling pressure and would require reassessment of the short-term outlook.
22,483 — 38.2% Fibonacci Retracement
This level represents the deeper corrective scenario. Unlikely in the near term unless a major negative macro catalyst emerges.
22,919 — March 2026 Correction Low / Key Support Floor
The structural low that must hold to maintain the bull market framework. A break below this level would be a serious technical deterioration.
Why Risk/Reward Is Poor for Bulls at 26,000+
There are three specific reasons why chasing the rally above 26,000 is a low-quality trade:
1. ATH Resistance Overhead
Buying at all-time high — after a near-vertical 3,900-point rally — means the upside is limited while the downside from a rejection at ATH could be 1,000–2,000 points. That is a 1:3 or worse risk/reward ratio.
2. No Consolidation Base
Strong, sustainable rallies are built on consolidation. The current move from 22,919 to 26,000+ has been almost entirely straight up. There is no base, no accumulation zone, no technical structure to fall back on. A single negative headline — a ceasefire collapse, a hot inflation print, or a disappointing earnings result — could trigger a sharp 1,000+ point reversal.
3. Momentum Exhaustion Signals
After a 2.5-week rally of this magnitude, momentum indicators are approaching overbought conditions. The market needs time to consolidate and reset before the next impulsive move higher.
The Pullback Scenario — What to Watch
My preferred scenario for NAS100 Futures over the coming days and weeks:
Step 1: Price either gets rejected outright, or makes a brief attempt above ATH before reversing.
Step 2: A pullback begins toward the 24,954–25,442 zone. This would represent normal, healthy corrective behaviour after a sharp rally.
Step 3: Price builds a base in the 24,954–25,442 zone with declining volume — indicating selling pressure is exhausting itself.
Step 4: A renewed breakout above 26,296 on strong volume confirms the next bullish leg is underway. Target: 27,000 and beyond.
What Would Invalidate the Pullback View?
A weekly close above 26,840 on strong volume and broad participation would suggest the market is stronger than expected and the ATH breakout is being sustained. In that scenario, the pullback thesis is invalidated and the focus shifts to 28,000 as the immediate target.
However, even in a bullish breakout scenario, buying above 26,296 with a stop below 25,882 offers limited risk/reward compared to waiting for the pullback entry at 24,954.
Key Catalysts This Week
Several macro events could be the trigger for the pullback we are anticipating:
Q1 Earnings Season — JPMorgan, Goldman Sachs, and other major banks reported this week. NFLX guidance lower.
US-Iran Geopolitical Situation — The ceasefire remains fragile. Any breakdown in negotiations would immediately reverse the risk-on rally that has driven NAS100 higher.
April 29 FOMC Meeting — Federal Reserve rate decision. Any hawkish surprise would be particularly negative for the rate-sensitive Nasdaq 100.
NAS100 Futures Outlook — Bearish Pullback Before Extension to 27,000
My outlook on NAS100 Futures is clear: the near-vertical rally from 22,919 to 26,000+ has created a poor risk/reward environment for new long positions. The smart trade is to wait for the pullback to the 24,954–25,442 zone before positioning for the extension toward 28,000.
Chasing breakouts at all-time high resistance after a 2.5-week straight-up rally is a low-probability trade. Patience is the edge here.
Watch the 26,380. Watch the Q1 earnings catalysts. And watch for the pullback opportunity that the market almost always delivers after moves this aggressive.
Want real-time NAS100 levels, Fibonacci targets, and precise trade setups for Nasdaq 100 Futures? Access ProSignalTrades Premium →
Get Tomorrow’s Setup Before the Market Opens
Daily signals · Live dashboards · Private Telegram · From €39/mo
🛡️ 30-Day Money Back Guarantee · Cancel Anytime
—
Disclaimer: This analysis is for educational purposes only and does not constitute financial advice. Trading involves significant risk. Always conduct your own research before making trading decisions.