The Invesco QQQ ETF — the benchmark tracker for the Nasdaq-100 index — has experienced one of its sharpest corrections of 2026, falling from an all-time high of $637 in early February down to a low of $558 in recent weeks. That’s a decline of over 12% in just six weeks, driven by a combination of rising oil prices, geopolitical uncertainty from the Iran conflict, Federal Reserve hawkishness, and a broad rotation out of growth stocks.
But beneath the surface of this selloff, something interesting is happening. The technical indicators are flashing some of the most extreme readings seen in years — and historically, those readings have preceded strong recoveries.
In this analysis, let me break down the QQQ price structure, identify the key levels every trader should watch, and explain why our current outlook is neutral to bullish for the weeks ahead.
For live QQQ price data, visit Investing.com QQQ ETF page. For Nasdaq-100 index composition, visit Nasdaq official site.
For context on the broader market, also read our SPY ETF S&P 500 Analysis.
QQQ Current Market Structure — A Deep Correction in a Bull Market
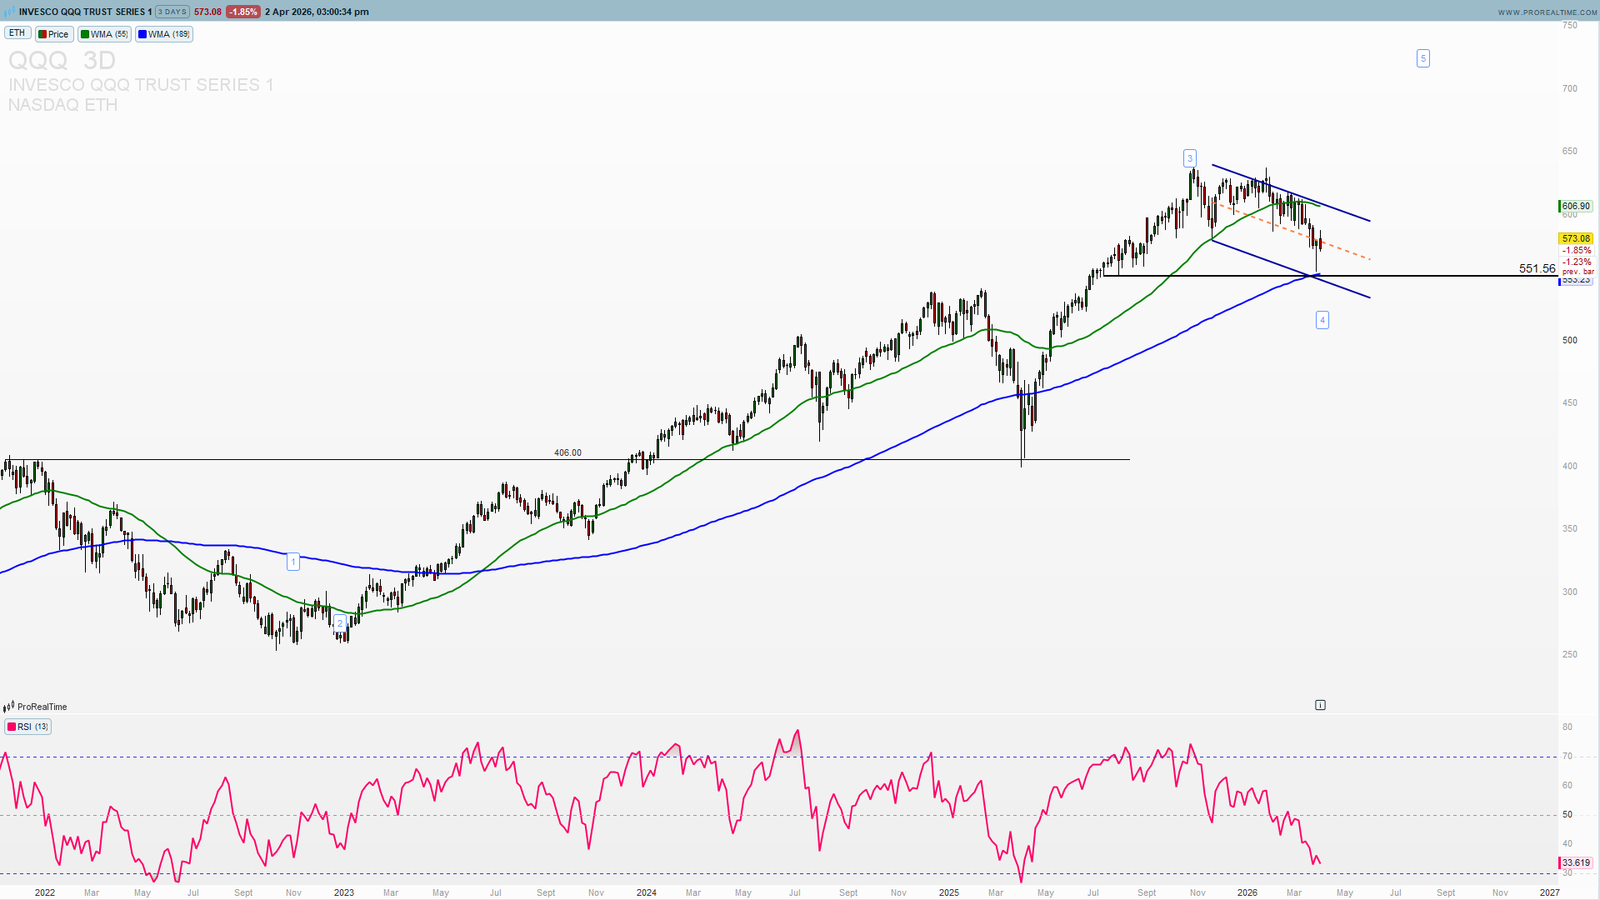
QQQ has spent the past two years in a broad uptrend, climbing from around $444 in early 2024 all the way to a closing high just above $628 in early February 2026. That’s a gain of over 40% in roughly two years — driven almost entirely by the AI revolution, mega-cap technology earnings, and the Federal Reserve’s shift toward rate cuts.
The current correction from the February peak is sharp but not unusual in the context of QQQ’s history. The ETF dropped below $410 during the April 2025 volatility spike before recovering strongly to end 2025 near $614. History shows that QQQ can absorb significant short-term shocks while the underlying bull trend remains intact — provided the key support levels hold.
The current price around $560–$570 puts QQQ in a critical technical decision zone. The next few weeks will determine whether this is a buyable correction or the beginning of a deeper bear phase.
Key Support and Resistance Levels
$637 — All-Time High / Major Resistance
The February 2026 closing high is the ultimate target for any bullish recovery. Getting back to these levels would require a meaningful shift in macro conditions and sentiment.
$590–$600 — Near-Term Resistance
QQQ has oscillated between $590 and $620 for much of February and March 2026. A sustained reclaim above $600 would be the first bullish signal suggesting the correction is over.
$577–$580 — Current Pivot Zone
QQQ is consolidating around this level. The 5-day moving average sits at $560, providing dynamic support just below current prices.
$558–$560 — Key Support
This is the most important near-term support level. Multiple analysts are watching this zone as the line in the sand — a break below $558 with conviction would signal further downside.
$519–$540 — Major Support / Demand Zone
In the event of a deeper correction, the $519–$540 range represents significant technical support. This zone aligns with the 90% probability range for the next 3 months based on current volatility analysis.
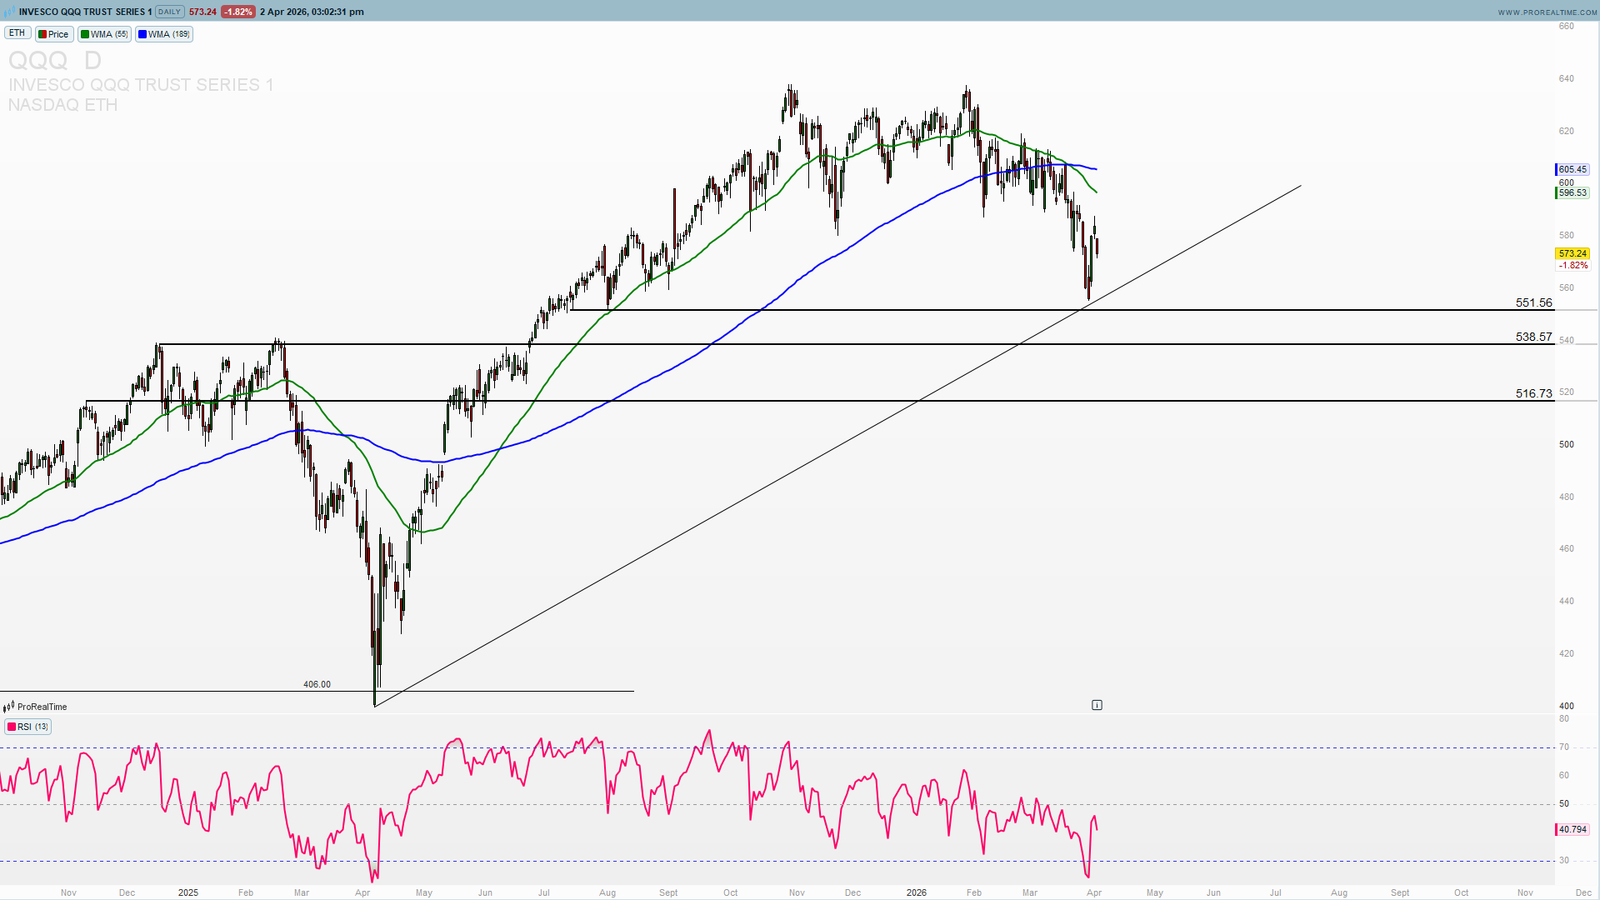
$402 — 52-Week Low
The extreme downside reference — this level would represent a full reversion to pre-AI-rally prices and is not part of our base case.
Technical Indicators — Extreme Oversold Readings
The most striking feature of the current QQQ setup is the technical indicator readings:
RSI at 19.5 — Extreme Oversold
The 14-day RSI for QQQ is sitting at just 19.5 — deep in oversold territory. Historically, RSI readings below 20 on QQQ have been rare and have typically preceded meaningful bounces. This is not a sell signal — it is an exhaustion signal for the sellers.
MACD at -6.03
The MACD is currently negative, indicating that downward momentum has been dominant. However, at these extreme levels, MACD crossovers to the upside often signal the beginning of recovery phases.
Monthly RSI — Strong Buy
While short-term indicators are bearish, the monthly timeframe shows a Strong Buy signal. This divergence between short-term oversold and long-term bullish is a classic setup for accumulation.
Volume Surge on March 31
QQQ gained 3.39% on March 31 with a volume surge — 94 million shares traded, significantly above average. High volume on up days after a sustained selloff is one of the strongest technical signals for a potential trend reversal.
Macro Environment — Headwinds Fading?
The QQQ selloff has been driven by macro factors rather than fundamental deterioration in the Nasdaq-100 companies themselves. Understanding these factors is key to the recovery thesis:
Oil Price Spike — Easing?
WTI crude surged above $100 following the Iran conflict and Strait of Hormuz disruptions. However, US-Iran diplomatic signals have emerged, and oil has begun retreating. If oil normalises toward $80-$90, the inflation pressure on tech valuations eases significantly.
Federal Reserve — Hawkish But Not Hiking
The Fed is holding rates steady with zero cuts priced for 2026. This is a headwind for growth stocks but not a catastrophic one — the key is that rates are not rising. Stable rates combined with easing oil could be the catalyst for a QQQ recovery.
AI Fundamentals Remain Strong
The underlying reason QQQ rallied 40%+ over two years — AI capital expenditure, hyperscaler revenue growth, and semiconductor demand — has not changed. Q1 2026 earnings from Microsoft, Meta, Alphabet and NVIDIA will be the crucial test of whether the AI investment thesis remains intact.
Trade Scenarios — Neutral to Bullish
Based on our analysis, here are the two key scenarios:
Bullish Scenario (Higher Probability):
– QQQ holds above $558 support
– Volume confirmation continues on up days
– Reclaims $590–$600 resistance zone
– Target: retest of $637 ATH and potentially $715 (Wall Street 12-month consensus)
Bearish Risk Scenario:
– Break below $558 with sustained selling
– Oil price re-escalation or Fed rate hike surprise
– Target: $519–$540 major support zone
– Extended bear case: $402 52-week low
Invalidation for Bull Case: Daily close below $519.
QQQ Outlook — Neutral to Bullish
Our current outlook on QQQ is neutral to bullish. The extreme oversold RSI reading, the volume surge on March 31, and the long-term monthly buy signal all suggest that the selling pressure is exhausting itself.
The key catalyst to watch is US-Iran diplomatic developments. Any resolution to the Strait of Hormuz situation would immediately reduce oil prices, ease inflation fears, and trigger a significant relief rally in tech stocks and QQQ.
For patient traders and investors, the current $558–$580 accumulation zone offers an interesting risk-reward setup — provided $558 holds and the macro backdrop continues to stabilise.
Want real-time QQQ levels, Elliott Wave counts, and precise trade setups? Access ProSignalTrades Premium →
—
Disclaimer: This analysis is for educational purposes only and does not constitute financial advice. Trading involves significant risk. Always conduct your own research before making trading decisions.