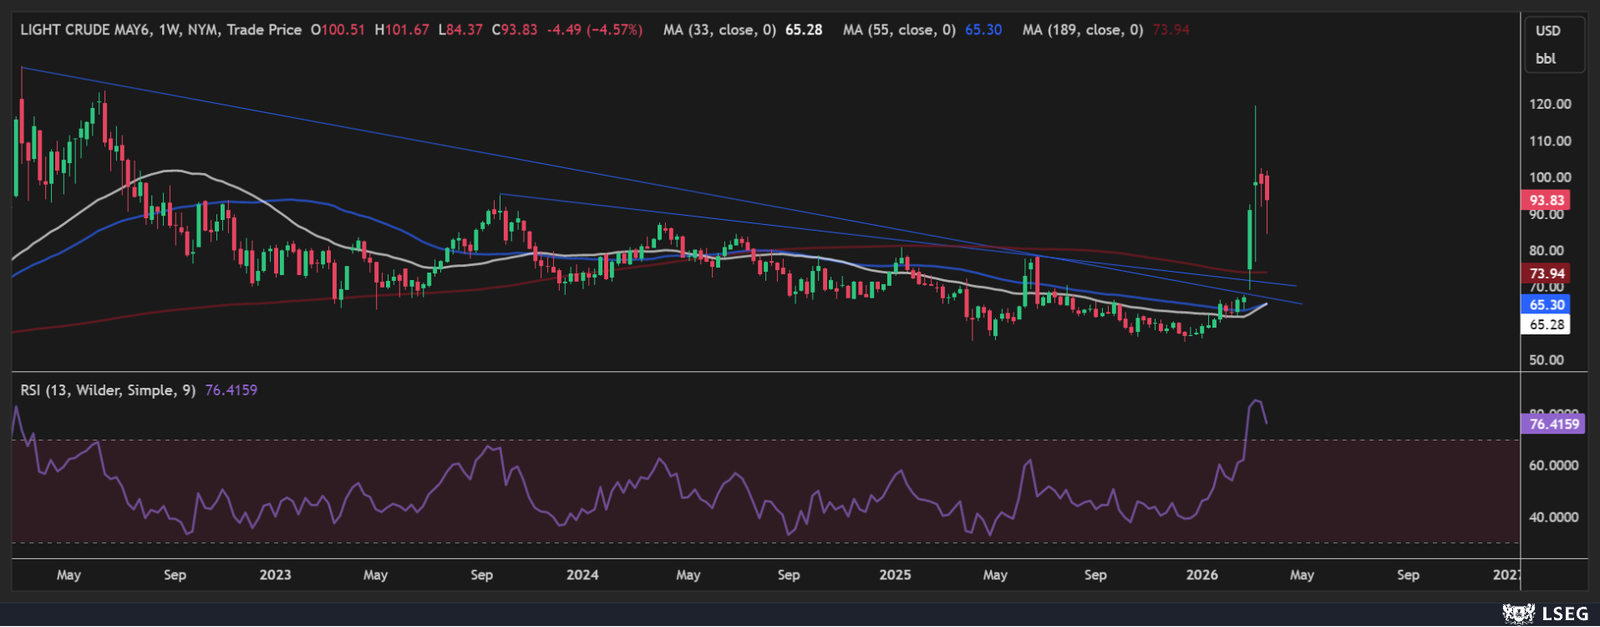
WTI crude oil has been one of the most volatile markets of 2026. After surging from multi-year lows near $55 all the way to a swing high of $120, driven by geopolitical tensions and Strait of Hormuz disruptions, the black gold is now pulling back sharply and trading around $91 per barrel.
For live WTI crude oil data, visit Trading Economics Crude Oil. For inventory data, check the EIA Weekly Petroleum Report.
With diplomatic signals emerging between the US and Iran, and oil inventories rising to their highest levels in two years, the question for traders is whether this is a temporary dip in a bullish trend — or the beginning of a significant reversal lower.
My analysis points to the latter.
WTI Current Market Structure — A Rally Built on Fear
The extraordinary surge in WTI from $55 to $120 was driven almost entirely by geopolitical risk premium — specifically, fears over the Strait of Hormuz closure and Iranian supply disruptions. This type of fear-driven rally is historically unstable and vulnerable to sharp reversals once the underlying catalyst fades.
The current price action confirms this concern. WTI has already pulled back over 25% from its $120 high to the current $91 level, breaking below key technical levels along the way. The momentum structure has shifted sideways to bearish on intraday timeframes, and the fundamental backdrop is becoming less supportive by the day.
Key Support and Resistance Levels
$97 — Critical Resistance Zone
This is the most important level on the chart right now. The $97 area is where WTI has encountered significant selling pressure. Any rally back toward $97 should be treated as a shorting opportunity until proven otherwise. A convincing daily close above $97 would neutralize our bearish thesis.
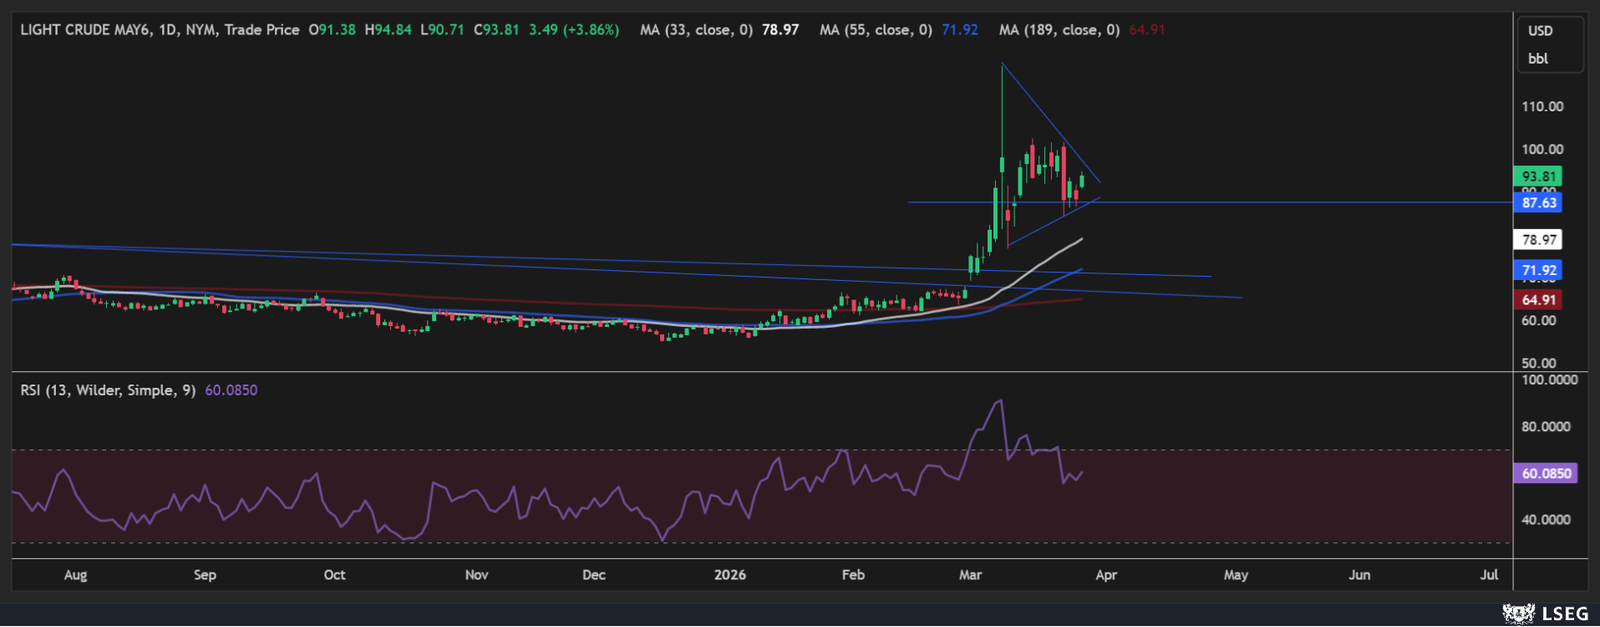
$91–$92 — Current Price / Short-Term Pivot
WTI is consolidating around $91–$92, sitting at a symmetrical triangle pattern. This is a decision point — the direction of the next breakout will determine the next significant move.
$87 — Key Support
The $87 level is my primary downside target on a break lower. This area aligns with the 61.8% Fibonacci retracement from the recent swing low and represents a significant technical support zone. A break below $87 would open the door for an accelerated move lower.
$73— Major Support / Demand Zone
The $70 psychological level is the next major floor. This area previously acted as strong resistance throughout much of 2025, and a retest as support would not be surprising in a deeper corrective move.
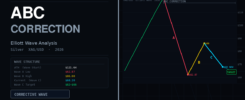
Elliott Wave Analysis — Wave Count Favors Bears
From an Elliott Wave perspective, the WTI move from $55 to $120 has the characteristics of a three-wave corrective rally (A-B-C) rather than a new impulsive bull market. Key observations:
The sharp, parabolic nature of the rally from $55 to $120 suggests a corrective bounce rather than a sustainable new uptrend. Corrective waves in commodities often retrace 50–61.8% of the entire move — which would target the $80–$87 zone.
If this Elliott Wave count is correct, the current price around $91 is still in the process of completing the correction, with further downside ahead before a real bottom is established.
Invalidation: A sustained break above $97 and especially above $100 would force a reassessment of the bearish scenario.
Fundamental Drivers Supporting the Bearish Case
Beyond technical analysis, several fundamental factors align with our bearish outlook:
Diplomatic De-escalation: US-Iran negotiations are ongoing. Any ceasefire or diplomatic breakthrough would immediately remove the geopolitical risk premium that inflated prices to $120. Markets are already pricing in some probability of resolution, as evidenced by the pullback from highs.
Inventory Build: US crude oil inventories recently surged by 6.9 million barrels — the largest weekly build in over two years. Rising inventories are a bearish signal, indicating that supply is outpacing demand.
Strong US Production: US oil production remains robust at 13.6 million barrels per day, limiting the supply shock from any Middle East disruption.
Demand Concerns: Both the IEA and OPEC have warned that global oil supply is set to outpace demand in 2026, creating a structural surplus even before accounting for any geopolitical resolution.
Trade Setup — Bearish Bias
Based on our technical and fundamental analysis, here is how we are approaching WTI crude oil:
Primary Bearish Scenario:
– WTI fails to reclaim $97 resistance
– Price breaks below $87 support with conviction
– Target: $73 psychological support
– Extended target: $65–$70 on full reversal
Short-Term Bounce Risk:
– Any rally toward $97 is a potential shorting area
– Watch for failed breakouts and bearish candle patterns at resistance
Bullish / Risk Scenario:
– Geopolitical escalation resumes unexpectedly
– Strait of Hormuz closure extends beyond expectations
– WTI closes above $97 — would neutralize bearish thesis
Invalidation Level: Daily close above $100.
WTI Outlook: Bearish — Target $87 and Below
My outlook on WTI crude oil is slightly bearish. The fear-driven rally from $55 to $120 is unwinding as diplomatic signals emerge from the Middle East, and the technical structure confirms that sellers are in control below $97.
The $97 resistance is the key level to watch. As long as WTI remains capped below this level, the path of least resistance is toward $87 and ultimately $80 in the weeks ahead.
For traders, this environment calls for patience — wait for rallies toward resistance to position for the downside, rather than chasing the move lower from current levels.
Want real-time WTI levels, Elliott Wave counts, and commodity trade setups? Access ProSignalTrades Premium →
—
Disclaimer: This analysis is for educational purposes only and does not constitute financial advice. Trading involves significant risk. Always conduct your own research before making trading decisions.