For our current index outlook, read the Nasdaq 100 Forecast and Market Complacency Signals.
Two of the most widely traded technology ETFs — Invesco QQQ (Nasdaq 100) and VanEck Semiconductor ETF (SMH) — are both showing signs of exhaustion after historic runs. QQQ is testing a steep, multi-year ascending trendline near $694 while trading at elevated RSI levels. SMH has already broken down from its $671.83 high, dropping over $115 to $555.98.
The question traders are asking: which ETF is more likely to break down first — and harder?
This analysis compares both charts side by side to identify which one carries the greater near-term downside risk.
For more large-cap technical setups, also read our NVDA and ORCL Analysis and our PLTR and MU Bearish Breakdown.
SMH — Already Breaking Down
The semiconductor ETF has the clearer bearish structure of the two right now, and it’s already in motion.
The Parabolic Top and Reversal
SMH staged an aggressive multi-month rally from the April 2026 low near $200 to a high of $671.83 — more than a 3x move. That kind of parabolic acceleration rarely resolves cleanly, and SMH has already begun its reversal, dropping to $555.98, down 1.51% on the week and off roughly 17% from the recent high.
SMA20 as the Line in the Sand
SMH is now trading just above its 20-week moving average at $480.99 — but the more immediate concern is the failed retest of the breakdown zone. The stock rallied sharply off the SMA50 ($376.47) earlier in 2026, and this current pullback is testing whether that uptrend structure still holds. A weekly close below $480.99 would confirm the SMA20 has flipped from support to resistance, opening room toward the SMA50 at $376.47 — a drop of over 30% from current levels.
RSI Cooling From Extreme Levels
RSI at 57.08 has come down significantly from what was almost certainly an extreme overbought reading during the parabolic phase into the $670s. This is the classic pattern of momentum rolling over after an unsustainable advance — RSI leads price, and the cooling we’re seeing now is consistent with a deeper corrective phase still playing out.
Elliott Wave Context
The move from the April 2026 base to $671.83 counts as a completed 5-wave impulse on the weekly chart. SMH is now in the early stages of an ABC correction. A 0.382–0.5 Fibonacci retracement of the entire advance projects toward the $480–$420 zone; a deeper 0.618 retracement — consistent with the SMA50 — projects toward $376.
SMH Key Levels
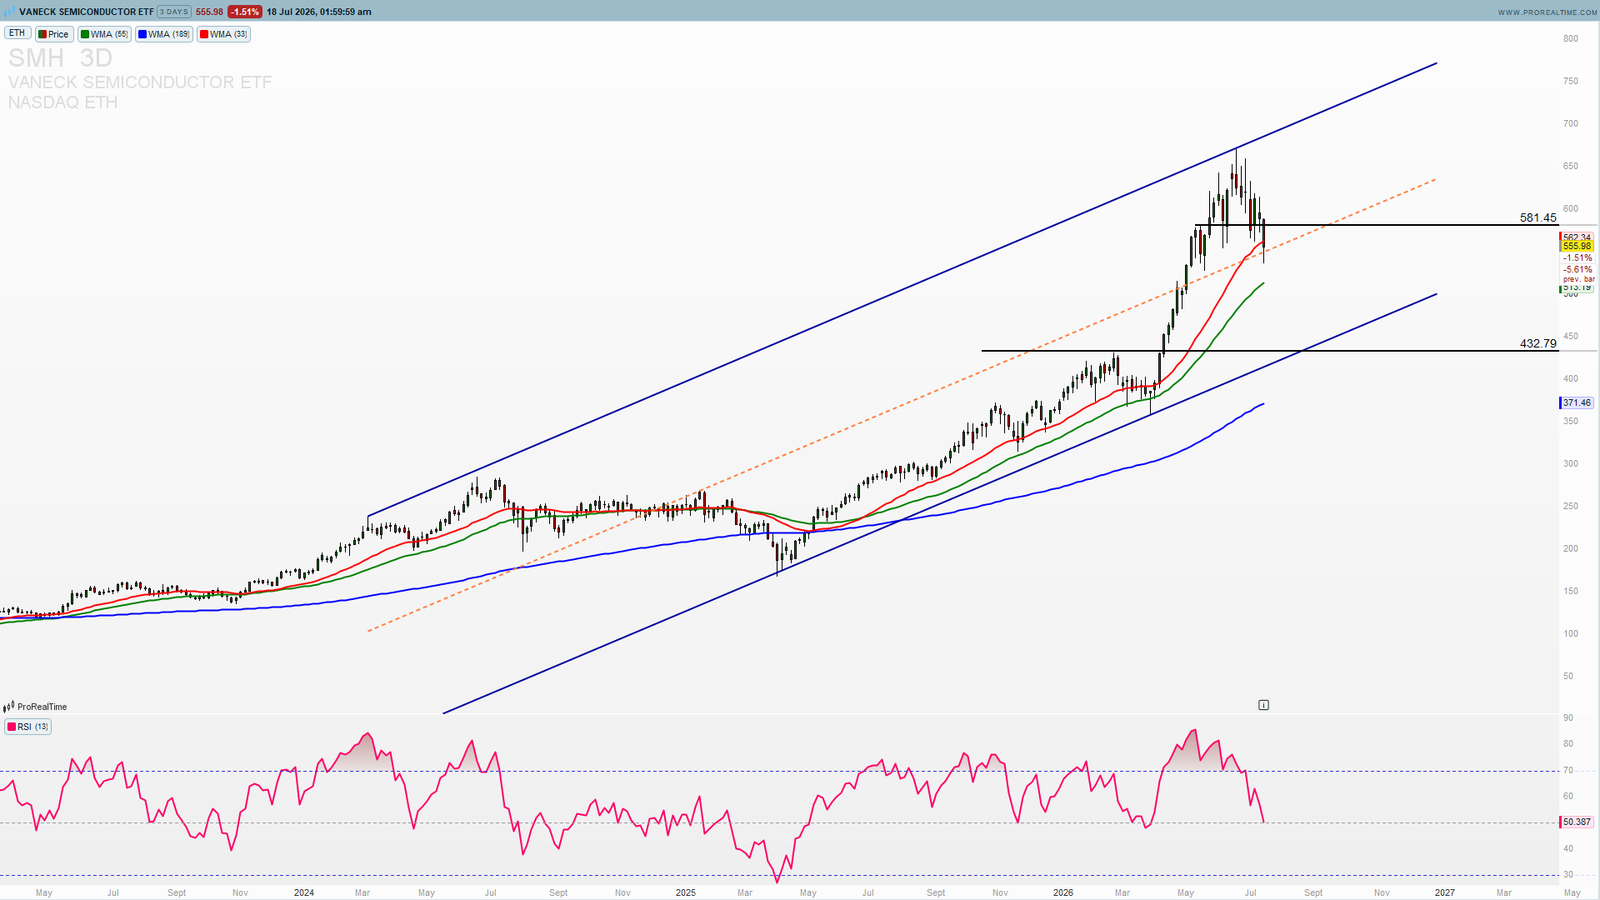
🔴 BEARISH BELOW $480.99
A weekly close below the 20-week moving average confirms the correction is deepening:
$480.99 — SMA20, immediate support/resistance pivot
$420–$430 — 0.5 Fibonacci retracement zone
$376.47 — SMA50, primary corrective target
🟢 BULLISH ABOVE $600
Reclaiming $600 would suggest the pullback was a shakeout rather than a genuine top:
$650 becomes the first recovery target
Retest of the $671.83 high back in play
QQQ — Testing the Trendline, Not Broken Yet
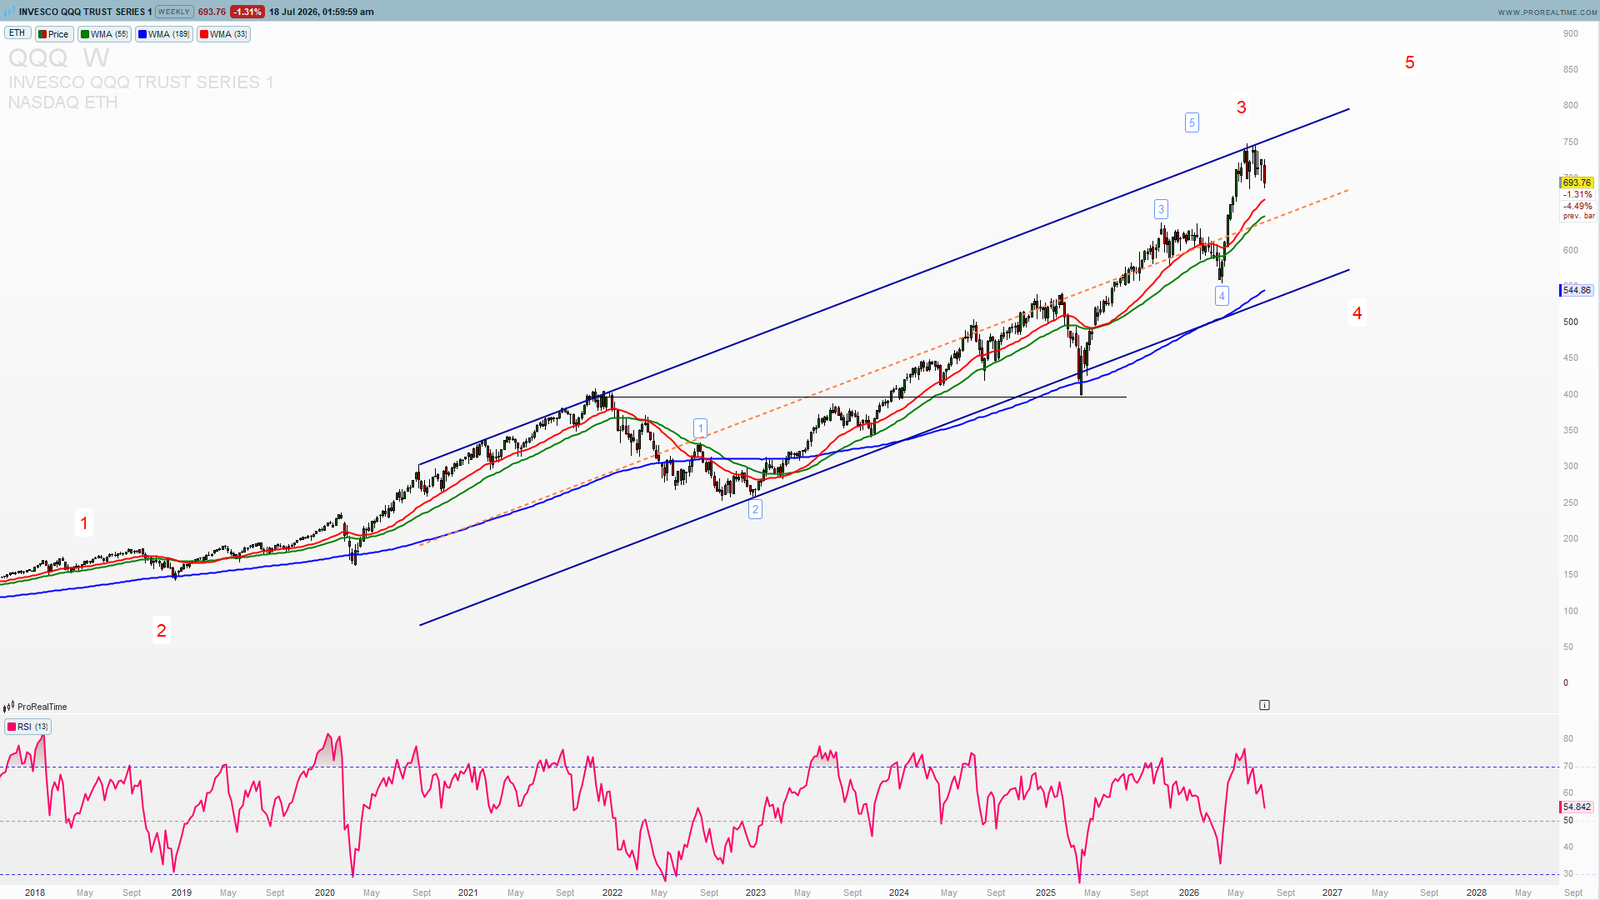
QQQ’s setup is structurally different from SMH — it hasn’t broken down yet, but it’s testing the outer edge of a trendline that has defined the entire post-2022 recovery.
The Steep Ascending Trendline
Since the 2022 low, QQQ has traded within a well-defined ascending channel. The current price of $693.76 is pressing directly against the upper boundary of that channel — the same steep trendline that has capped or coincided with prior local tops throughout the advance. Testing this line doesn’t guarantee a reversal, but it is historically where QQQ has seen its sharpest short-term pullbacks.
Horizontal Support Well Below
The more important structural level on this chart is the horizontal support/resistance zone around $538.97 — the breakout level from the 2024 consolidation range that preceded the current leg higher. This zone, combined with the SMA20 at the same approximate level, represents the first real structural floor beneath current price. That’s a meaningful distance below $693.76 — over 22% — which means QQQ has considerably more room to fall before testing genuine structural support compared to SMH.
RSI Still Elevated
At 69.10, QQQ’s RSI remains firmly in overbought territory, well above SMH’s cooling 57.08 reading. This suggests QQQ’s momentum hasn’t turned yet — the index is still being bought aggressively even as it tests trendline resistance. Historically, RSI needs to roll over from these levels before a genuine correction develops; QQQ hasn’t shown that rollover yet.
Elliott Wave Context
The rally from the 2022 low continues to unfold as a large-degree impulsive structure, and price testing the upper trendline is consistent with a late-stage Wave 5 or a Wave 3 extension, depending on the sub-wave count. Unlike SMH, there’s no confirmed reversal signal yet — QQQ requires a trendline break and RSI rollover before the bearish case strengthens materially.
QQQ Key Levels
⚠️ NEUTRAL-TO-BULLISH — Trendline Intact
As long as QQQ holds the ascending trendline, the structure remains bullish:
$693.76 — current price, pressing trendline resistance
$538.97 — major horizontal support, ~22% below current price
$405.82 — SMA50, deep structural floor
🔴 BEARISH ON TRENDLINE BREAK
A confirmed break and weekly close below the ascending trendline, combined with RSI rolling below 50, would open:
$600–$610 — first meaningful support on a breakdown
$538.97 — major structural target if the correction extends
Which One Breaks Down Faster? The Verdict
Based purely on current chart structure, SMH is both further along in its correction and has less distance to fall before hitting genuine support — but that also means it has less room left before a bounce becomes likely. QQQ, by contrast, hasn’t broken its bullish structure yet, but if it does, it has significantly more room to fall (roughly 22% to the first major support versus SMH’s more proximate SMA20/SMA50 zones).
The practical read:
SMH is the faster-moving, already-in-progress correction — the semiconductor sector tends to lead both up and down due to its higher beta, and that’s exactly what’s playing out here. Traders looking for a setup that’s already confirmed should focus on SMH’s $480.99 level as the near-term trigger.
QQQ is the slower-moving but potentially larger setup — it hasn’t broken yet, but if the trendline gives way with RSI confirmation, the eventual move down carries more room and often more velocity once it starts, precisely because index-level breakdowns tend to be sharper after such extended, low-volatility advances.
What to Watch This Week
SMH — SMA20 Hold or Break
$480.99 is the level. A weekly close below triggers acceleration toward $420 and eventually $376.
QQQ — Trendline and RSI
Watch for a decisive break of the ascending trendline combined with RSI crossing below 50 — until both happen together, the bullish structure remains technically intact despite the elevated readings.
the QQQ & SMH Moves
MU
AMD
CRWD
PLTR
TSLA
+5 more
✓ Full valuation multiples
✓ Bull & Bear case analysis
QQQ and SMH — Summary
SMH at $555.98:
🔴 Already correcting — bearish below $480.99, targets $420 → $376
🟢 Invalidated above $600
QQQ at $693.76:
⚠️ Structure intact — bearish only on confirmed trendline break + RSI rollover
🎯 Downside target on break: $538.97 (~22% below current price)
Both ETFs carry real downside risk, but they’re at different stages of the same broader rotation out of high-beta tech. SMH is the leading indicator — watch how it resolves at $480.99 for an early read on whether QQQ’s trendline test ultimately breaks too.
QQQ Live Price — Investing.com
SMH Live Price — Investing.com
Want the full institutional-grade research behind the stocks driving these ETFs? Our 11-report bundle covers NVDA, MU, CRWD, TSLA, AMD and more for €79.
—
Disclaimer: This analysis is for educational purposes only and does not constitute financial advice. Trading involves significant risk. Always conduct your own research before making any investment decisions.