Silver (XAG/USD) has been hit hard. After rallying to $89 just days ago — posting one of the strongest weekly performances in years — the metal has sold off sharply, dropping over 9% in a single session to trade at $74–$76 on May 16, 2026. The catalyst: a toxic combination of surging US inflation data, hawkish Federal Reserve pricing, and a strengthening US dollar that has temporarily overwhelmed the bullish fundamental case for precious metals.
But here is the critical question: is this a trend reversal, or is this the buy-the-dip opportunity that smart traders have been waiting for?
Our analysis points clearly to the latter. The $74–$76 zone represents a major technical confluence support area, the long-term fundamental case for Silver is stronger than ever, and the current selling pressure appears to be positioning-driven rather than a fundamental shift. We are bullish.
For context, also read our ABC Correction in Silver — Elliott Wave Guide and Gold XAU/USD Analysis.
What Just Happened — Why Silver Dropped 9% in One Session
The Silver selloff was triggered by a combination of macro data releases that blindsided precious metals bulls:
US Import and Export Prices Surged
Both US import and export prices rose far more than expected in April 2026, driven by rising fuel import costs and surging non-agricultural export prices. This data came on top of already hot CPI and PPI prints, painting a picture of persistent inflation that the Federal Reserve cannot ignore.
Fed Rate Cut Expectations Collapsed
Markets have now fully priced out any Federal Reserve rate cuts for 2026. More alarmingly, some traders are beginning to price in a rate hike by December — a scenario that would be significantly negative for non-yielding assets like Silver and Gold. A stronger-for-longer Fed means higher real yields, which directly pressures precious metals valuations.
UBS Cut Silver Demand Forecast
UBS strategists reduced their full-year investment demand estimate for Silver from over 400 million ounces to 300 million ounces, citing weaker industrial usage and increased mine supply. This headline added fuel to the selloff.
India Import Tariff Increase
India raised import tariffs on gold and silver to 15% from 6% — a demand headwind from one of the world’s largest silver consuming nations.
However — and this is crucial — none of these factors change the multi-year structural bull case for Silver. They are short-term headwinds that create temporary price dislocations. History shows that these dislocations are opportunities, not warnings.
Why $74–$76 Is a Major Technical Support Zone
The $74–$76 zone is not random. It represents a powerful confluence of technical factors:
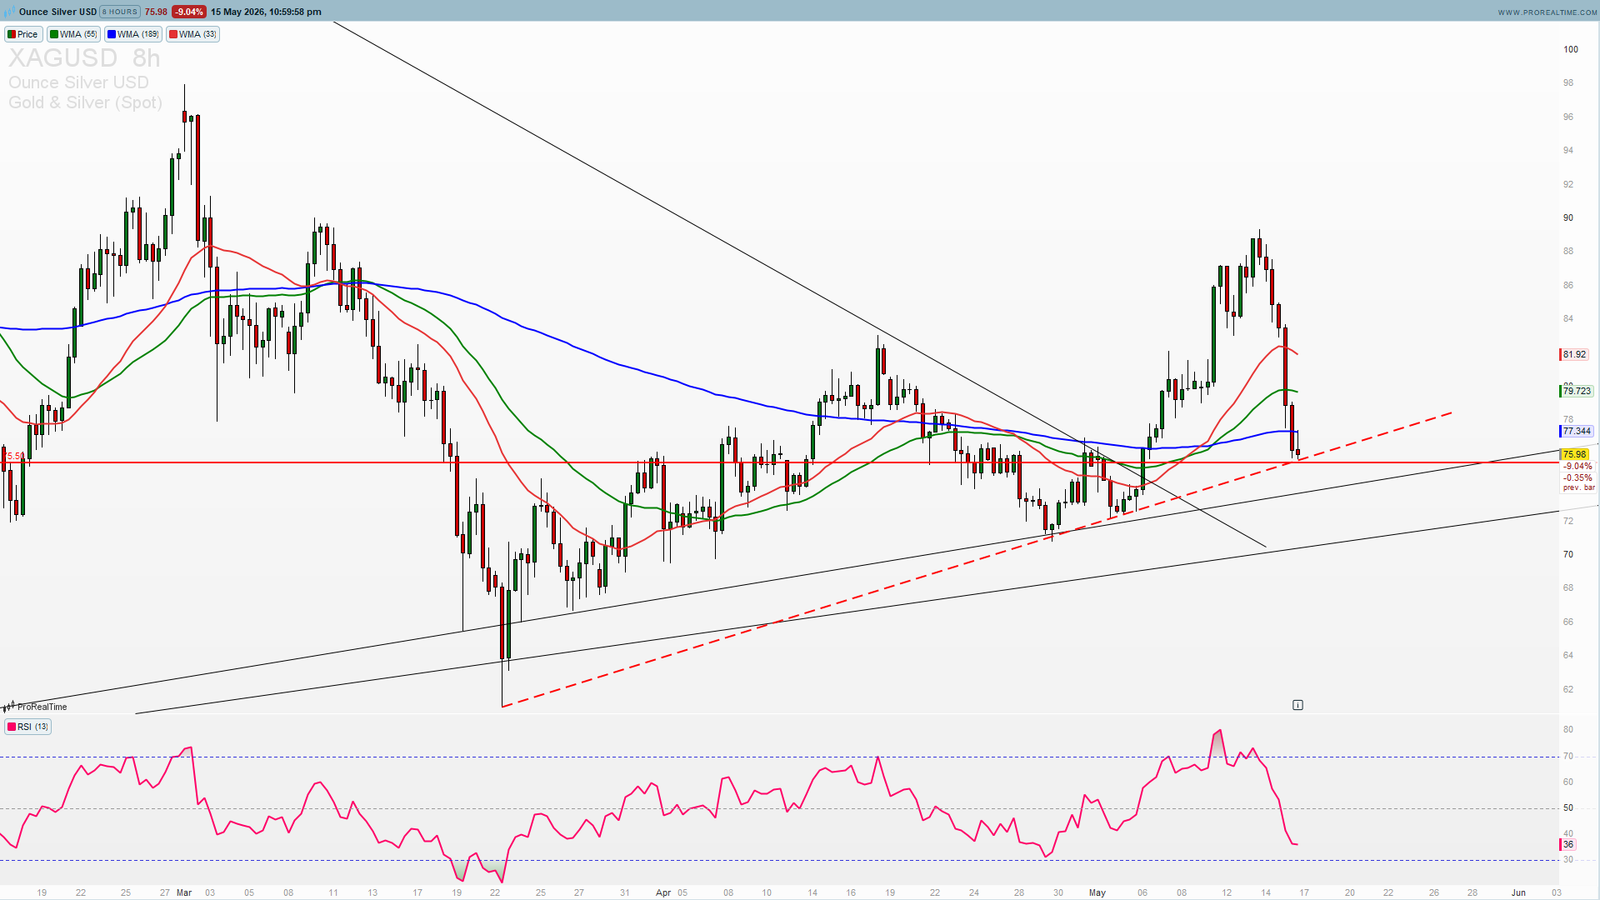
MA5 at $76.41 — Dynamic Support
The 5-day moving average sits at $76.41 — a level that has acted as dynamic support throughout Silver’s 2026 bull run. Price testing this level after a sharp selloff is a classic setup for a bounce.
MA10 at $75.17 — Key Support
The 10-day moving average at $75.17 sits directly within the $74–$76 support zone, providing additional technical confirmation. Silver has historically bounced strongly from the MA10 during corrective phases in bull markets.
MA20 at $76.73 — Confluence
The 20-day moving average at $76.73 adds a third layer of support in this zone. Three converging moving averages in the same $74–$77 range create a very strong support cluster.
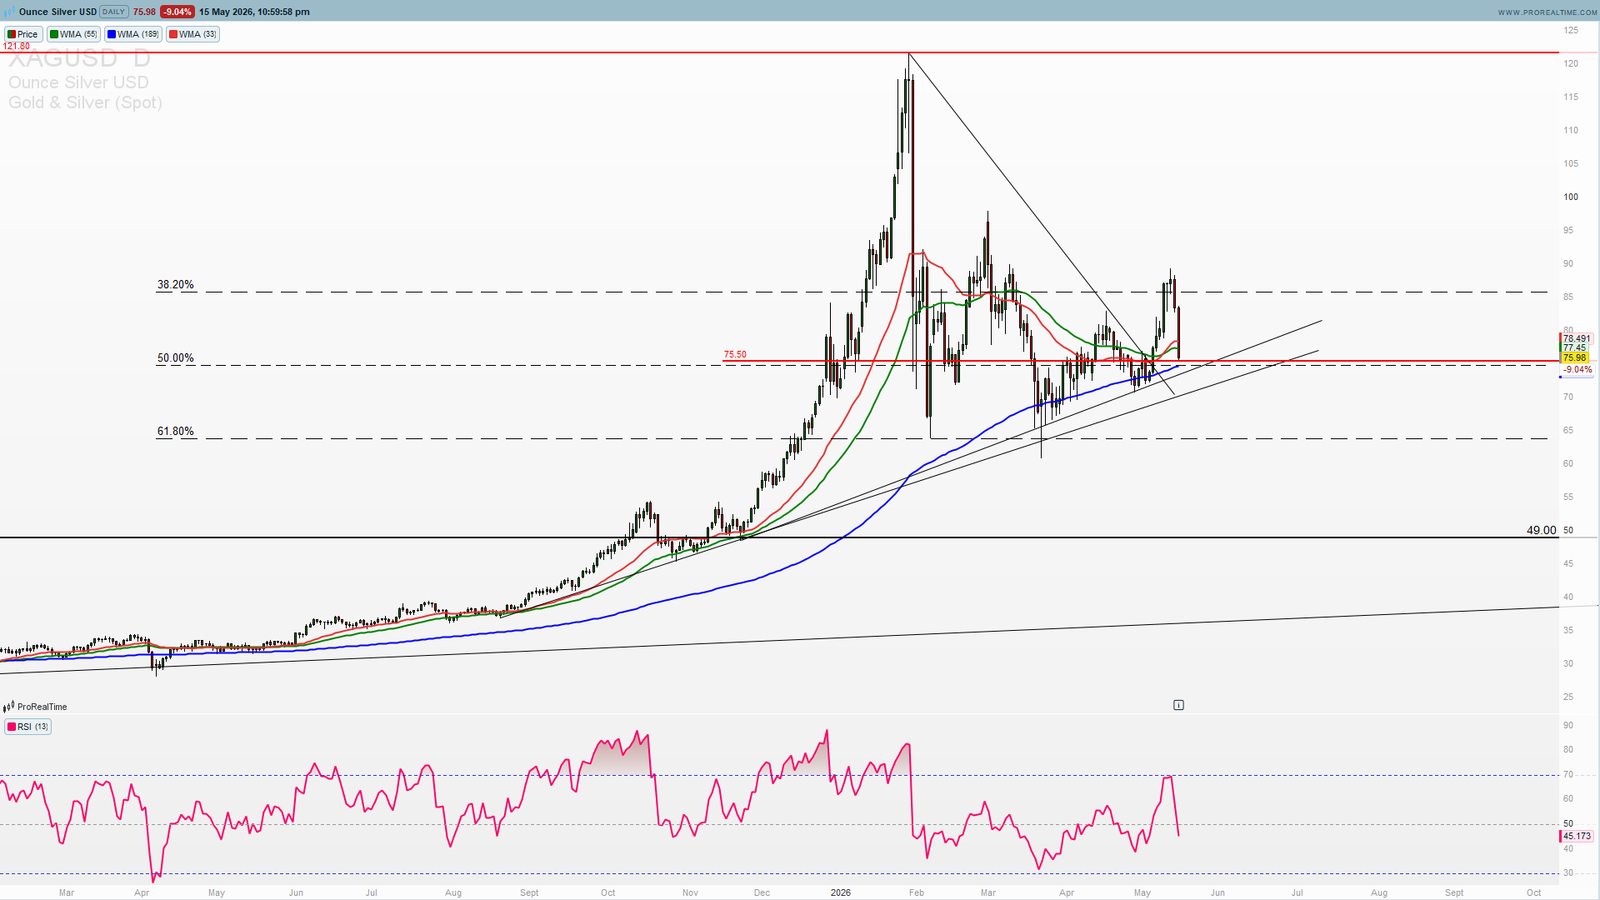
MA200 at $64.15 — Long-Term Bull Market Intact
The 200-day moving average is at $64.15 — far below current prices. This confirms that Silver remains firmly within a long-term bull market. The selloff to $74–$76 has not even come close to threatening the long-term trend.
RSI at 45— Oversold
The sharp 9% single-session decline, send RSI remains at 45 — oversold territory. This means the dip is a correction within an ongoing bull trend, not an exhaustion signal. Silver has significant room to recover from current levels before the RSI reaches extreme readings.
50-Day EMA at $77.13 — Immediate Resistance After Recovery
A recovery from $74–$76 toward the 50-day EMA at $77.13 represents the first logical target. A sustained break above this level would signal the correction is over and the bull trend is resuming.
Live XAG/USD price — Investing.com
Silver Institute — Industrial demand data
The Macro Case for Silver Remains Stronger Than Ever
Despite the short-term macro headwinds, the structural bull case for Silver in 2026 and beyond is arguably the strongest in the metal’s modern history:
Industrial Demand — Structural Growth
It’s industrial applications continue to expand at an accelerating pace. Solar panel manufacturing is now the largest single source of Silver demand, and the global energy transition is still in its early stages. AI hardware, electric vehicles, and 5G infrastructure all require significant Silver content.
Supply Deficit
The Silver market has been in structural supply deficit for multiple consecutive years. Mine supply growth cannot keep pace with the rapid expansion of industrial demand. This fundamental imbalance is the foundation of the bull market.
Gold/Silver Ratio
The Gold/Silver ratio remains elevated, suggesting Silver is significantly undervalued relative to Gold on a historical basis. When this ratio normalises, Silver typically outperforms Gold dramatically. This creates an asymmetric upside opportunity for Silver at current levels.
Federal Reserve — Rate Cuts Still Coming, Eventually
While markets have priced out 2026 rate cuts following the latest inflation data, the long-term trajectory for US interest rates is still downward. When rate cuts eventually materialise — whether in late 2026 or 2027 — Silver will be a primary beneficiary.
ATH at $121.58 Still in Play
Silver’s all-time high of $121.58 in January 2026 is still less than 60% above current prices. The factors that drove Silver to that level — inflation, geopolitical risk, industrial demand, dollar weakness — have not permanently reversed.
Key Levels to Watch
$74.8 — WMA189 / Strong support
The first level of defense for bulls. A daily close below $74.8 would signal the dip could continue to $71 uptrend line.
$76.73 — MA20 / Immediate Resistance
The first level to reclaim for bulls. A daily close above $76.73 would signal the dip is over and the recovery has begun.
$77.13 — 50-Day EMA / Key Resistance
Reclaiming the 50-day EMA is the critical signal for a bullish trend resumption.
$80–$82 — Next Target After Recovery
The previous consolidation zone from early May. A recovery to this level would represent a full reversal of the recent selloff.
$85–$89 — Resistance Zone
The range Silver was trading before the selloff. Reclaiming this area would confirm the bull market is fully intact.
$74.00 — Critical Support Floor
A sustained break below $74.00 with strong volume would be a warning signal and would require reassessment of the short-term outlook.
$70–$72 — Deep Support
In the event of further selling pressure, the $70–$72 zone aligns with the previous breakout level and would represent maximum pain before a recovery.
Invalidation: Daily close below $68 with conviction.
Trade Scenarios — Bullish Bias
Primary Bullish Scenario:
XAGUSD holds $74 support, stabilises in the $74–$76 zone over the next 1–2 sessions, then recovers above the MA20 at $76.73 and the 50-day EMA at $77.13. Targets: $80–$82, then $85–$89 resistance zone.
Extended Bullish Scenario:
If macro headwinds ease — Fed softens rate hike talk, inflation data improves, or geopolitical tensions ease — Silver could stage a rapid recovery back toward the ATH at $121.58. The fundamental demand drivers make this a realistic medium-term scenario.
Bearish Risk:
A confirmed break below $74 with continuation selling, driven by an actual Fed rate hike announcement or a major deterioration in industrial demand. Target: $70–$72.
Conclusion — XAGUSD at $74–$76 Is a High-Conviction Buy the Dip
Silver’s 9% single-session selloff to the $74–$76 support zone is painful for existing longs. But it is creating one of the most attractive buy-the-dip setups of 2026.
Three converging moving averages, an RSI at neutral 58 with significant room to recover, a 200-day MA far below at $64 confirming the long-term bull trend, and fundamental demand drivers that are structurally intact — all of this points to the same conclusion.
The macro headwinds that caused this selloff — inflation data, Fed rate hike talk, UBS demand cut — are short-term. The industrial demand revolution, supply deficits, and gold/silver ratio reversion are long-term. Short-term noise does not change long-term signal.
Watch $74 as the line in the sand. Above it — accumulate. Below it — wait for stabilisation.
Want real-time XAGUSD levels, Elliott Wave counts, and precise trade setups? Access ProSignalTrades Premium →
—
Disclaimer: This analysis is for educational purposes only and does not constitute financial advice. Trading involves significant risk. Always conduct your own research before making trading decisions.