The SPDR S&P 500 ETF (SPY) has pulled back sharply from its all-time high of $697.84 set in January 2026, and is now trading around $648 — down over 5% from peak levels. After weeks of selling pressure driven by geopolitical uncertainty, rising oil prices, and Federal Reserve concerns, the key question for traders and investors is simple: is this a buyable dip, or the beginning of a deeper correction?
In this analysis, we break down the current SPY price structure, identify the critical support and resistance levels, and present our technical outlook for the weeks ahead.
SPY Current Market Structure
For real-time SPY price data, visit Investing.com SPY ETF page. According to the S&P Dow Jones Indices, the S&P 500 remains the benchmark for US large-cap equity performance.
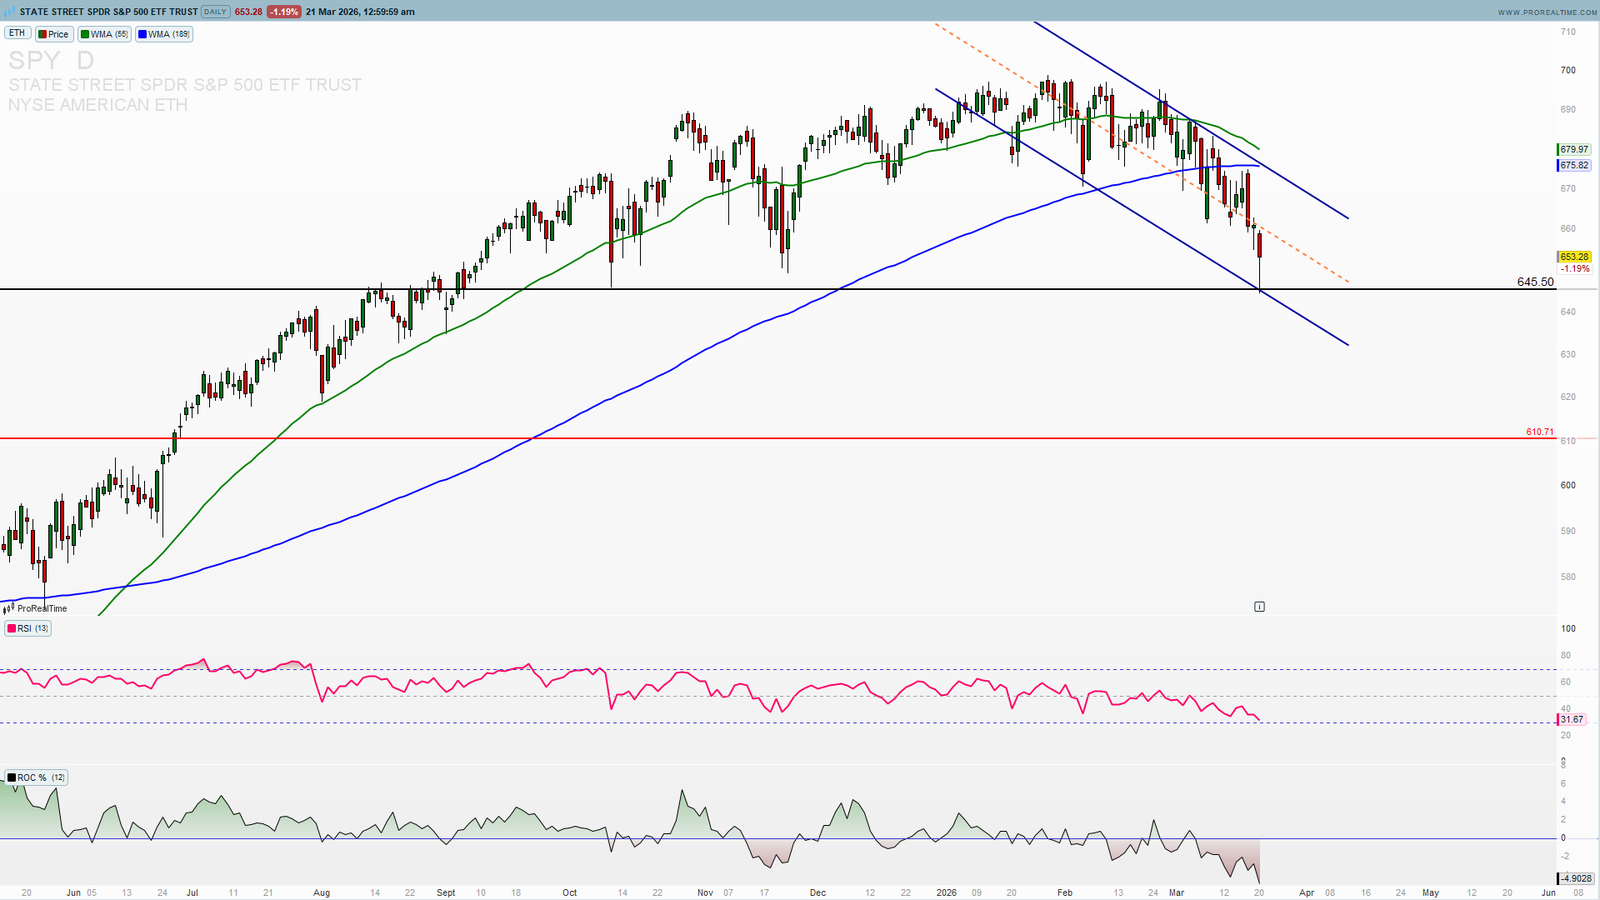
SPY is currently in a corrective phase after an extended bull run throughout 2025. The ETF gained over 15% in the past year, peaking at $697.84 before encountering significant selling pressure in early 2026.
The price action since the January peak has been characterized by lower highs and lower lows on the daily timeframe — a classic corrective structure. However, the broader trend context remains bullish: SPY is still trading well above its longer-term moving averages and the overall uptrend from 2023 remains intact.
The current consolidation zone between $640 and $665 represents a critical decision point. How SPY resolves this range will determine the next directional move.
Key Support and Resistance Levels
Understanding the key price levels is essential for any SPY trade setup.
$640 — Key Support Zone
This is the most important level on the chart right now. The $640 area represents both a technical support zone and a psychological round number. A sustained close below $640 would signal that the corrective move is extending and would open the door to a deeper pullback toward the $600–$620 area.
$648 — Current Price / Short-Term Pivot
SPY is consolidating around $648. This is a neutral zone — neither strong support nor resistance. Price needs to make a decisive move above $665 or below $640 to signal the next direction.
$665–$667 — Immediate Resistance
The $665–$667 zone is where SPY has encountered sellers recently. A breakout and daily close above this level would be a bullish signal, suggesting the correction may be complete.
$680–$697 — ATH Zone / Major Resistance
The all-time high area at $697.84 represents the ultimate target for any bullish recovery. Getting back to these levels would require a meaningful shift in market sentiment.
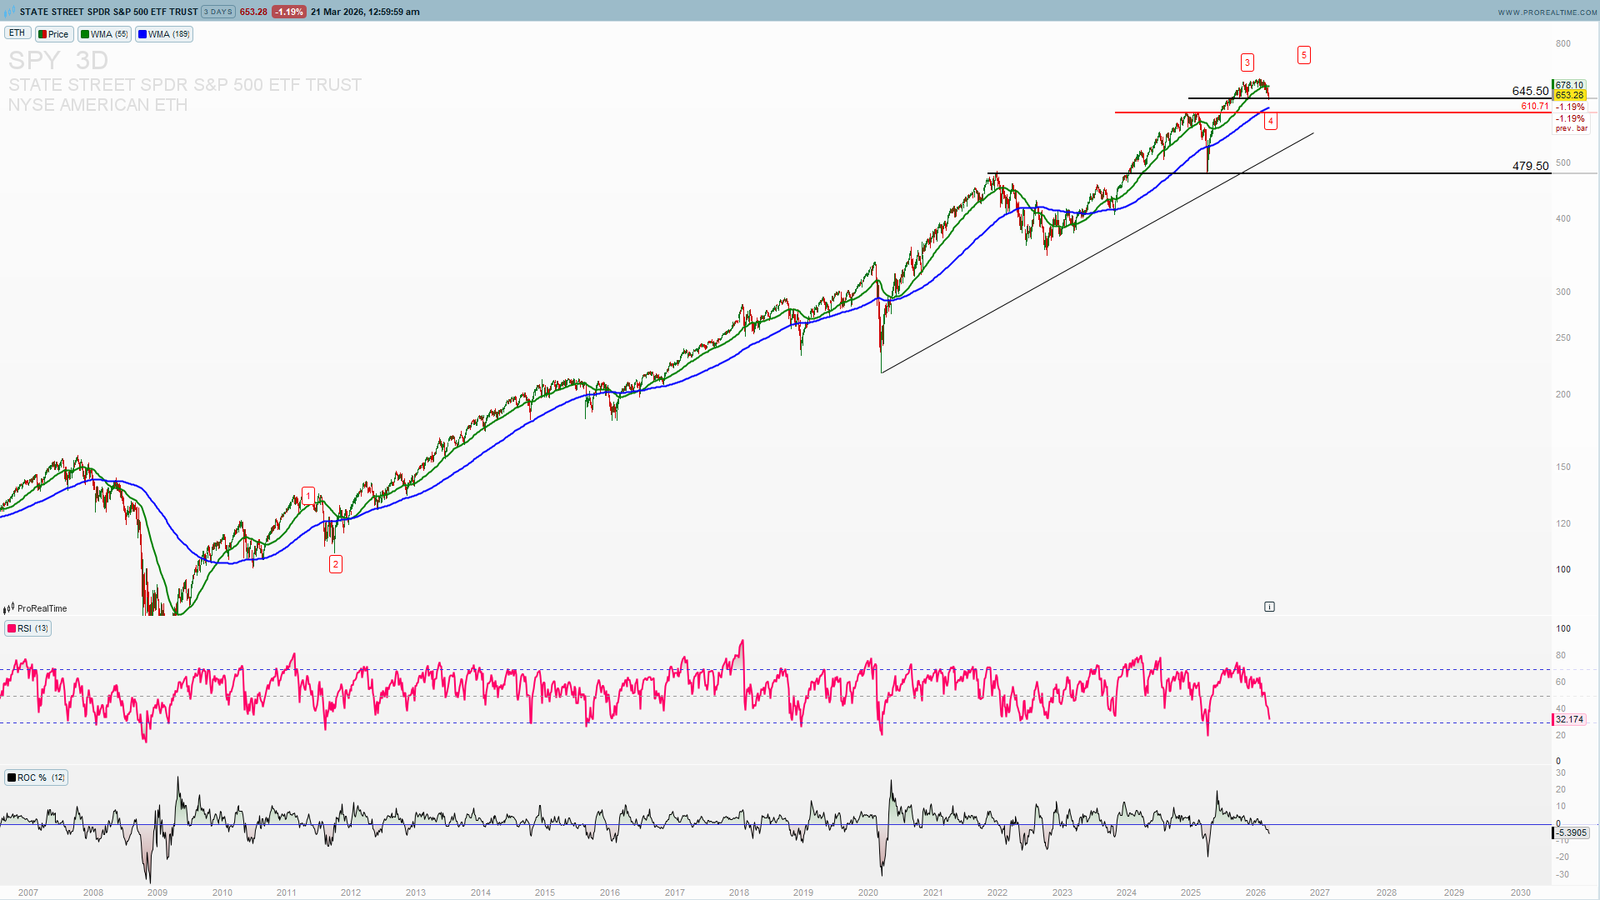
Elliott Wave Analysis — Where Is SPY in the Cycle?
From an Elliott Wave perspective, the current pullback from the January 2026 high has the characteristics of a corrective wave (either a Wave 4 or an A-B-C correction). Key observations:
The decline from $697 to the current $648 area represents approximately a 7% correction — well within the normal range for a healthy Wave 4 pullback in a bull market structure.
If this is a Wave 4 correction, the key level to hold is $640. A sustained break below $640 would suggest a more complex or deeper correction is underway, potentially targeting the $600–$620 demand zone.
The bullish scenario: SPY finds support at $640, completes the corrective structure, and launches a Wave 5 advance targeting new all-time highs above $700.
Macro Environment — What’s Driving SPY
Recent pullback is not happening in a vacuum. Several macro factors are weighing on the S&P 500:
Geopolitical Risk: Elevated tensions in the Middle East are boosting oil prices and creating uncertainty. Markets historically struggle when geopolitical risk premiums are elevated. But this could be short-lived.
Federal Reserve Policy: Concerns about persistent inflation are limiting the Fed’s ability to cut rates, removing a key tailwind that supported equities throughout 2025.
Oil Price Spike: Rising energy costs act as a tax on consumers and corporate margins, creating headwinds for earnings growth.
Technical Sell Signals: SPY is currently trading below its 50-day moving average, which sits around $667. This is a bearish technical signal in the near term.
Trade Setup & Scenarios
Given the current price action and technical structure, here is how I am approaching this ETF:
Bullish Scenario (Range Hold):
– SPY holds above $640 key support
– Price consolidates between $640–$665
– Breakout above $665 triggers next leg higher
– Target: retest of ATH zone $695–$700
Bearish / Risk Scenario:
– Break below $640 with conviction
– Deeper pullback toward $620–$600 demand zone
– This would represent a 10–14% total correction from ATH
– Still within normal bull market correction range
Invalidation:
A close below $600 would force a serious reassessment of the bull market thesis.
SPY Outlook: Neutral — Key Levels Will Decide
My current outlook on SPY is neutral to bullish. The corrective structure from the January high is still playing out, and the $640 support level is the line in the sand.
Traders should focus on price action around $640 for directional clues. A bounce and recovery back above $665 would shift our bias back to bullish. A breakdown below $640 would suggest further downside before the next buying opportunity.
For longer-term investors, the current pullback represents a potential accumulation opportunity — provided $640 holds. The overall trend from 2023 remains intact, and any correction to the $620–$640 zone historically has been a strong buying area for patient investors.
Want real-time SPY levels, Elliott Wave counts, and trade setups? Access ProSignalTrades Premium →
—
Disclaimer: This analysis is for educational purposes only and does not constitute financial advice. Trading involves significant risk. Always do your own research before making trading decisions.