DXY to reverse higher?
The US Dollar has faced relentless selling pressure in recent months, as markets continue to reassess Federal Reserve monetary policy expectations, shifting geopolitical risks, and realigning global capital flows. The narrative has been consistent — a weakening dollar, driven by expectations of rate cuts, growing fiscal concerns, and a broader rotation away from US assets. Yet history has repeatedly shown that the most powerful and sustainable reversals tend to emerge precisely when market consensus turns overwhelmingly bearish and positioning becomes dangerously one-sided.
DXY is now trading at a critical technical juncture. After breaking below several key support levels and trending lower through the first months of 2026, the index is approaching zones that have historically acted as major inflection points. Whether this marks the beginning of a genuine recovery — or simply a brief pause before the next leg lower — is the defining question for dollar traders right now.
The macro backdrop remains complex. On one hand, the Fed’s cautious stance on rate cuts, still-resilient US economic data, and potential safe-haven demand could provide the fundamental fuel needed to lift the dollar. On the other hand, structural headwinds including rising US debt concerns, de-dollarization trends, and improving growth prospects outside the United States continue to cap any meaningful upside. The bulls and bears are evenly matched — and that tension is exactly what makes this setup so compelling to analyze.
In this analysis, we take a deep dive into the technical structure of DXY, identify the key price levels that matter most, and examine the macro catalysts that could either confirm a prolonged downtrend — or trigger the dollar reversal that the majority of the market is not positioned for.
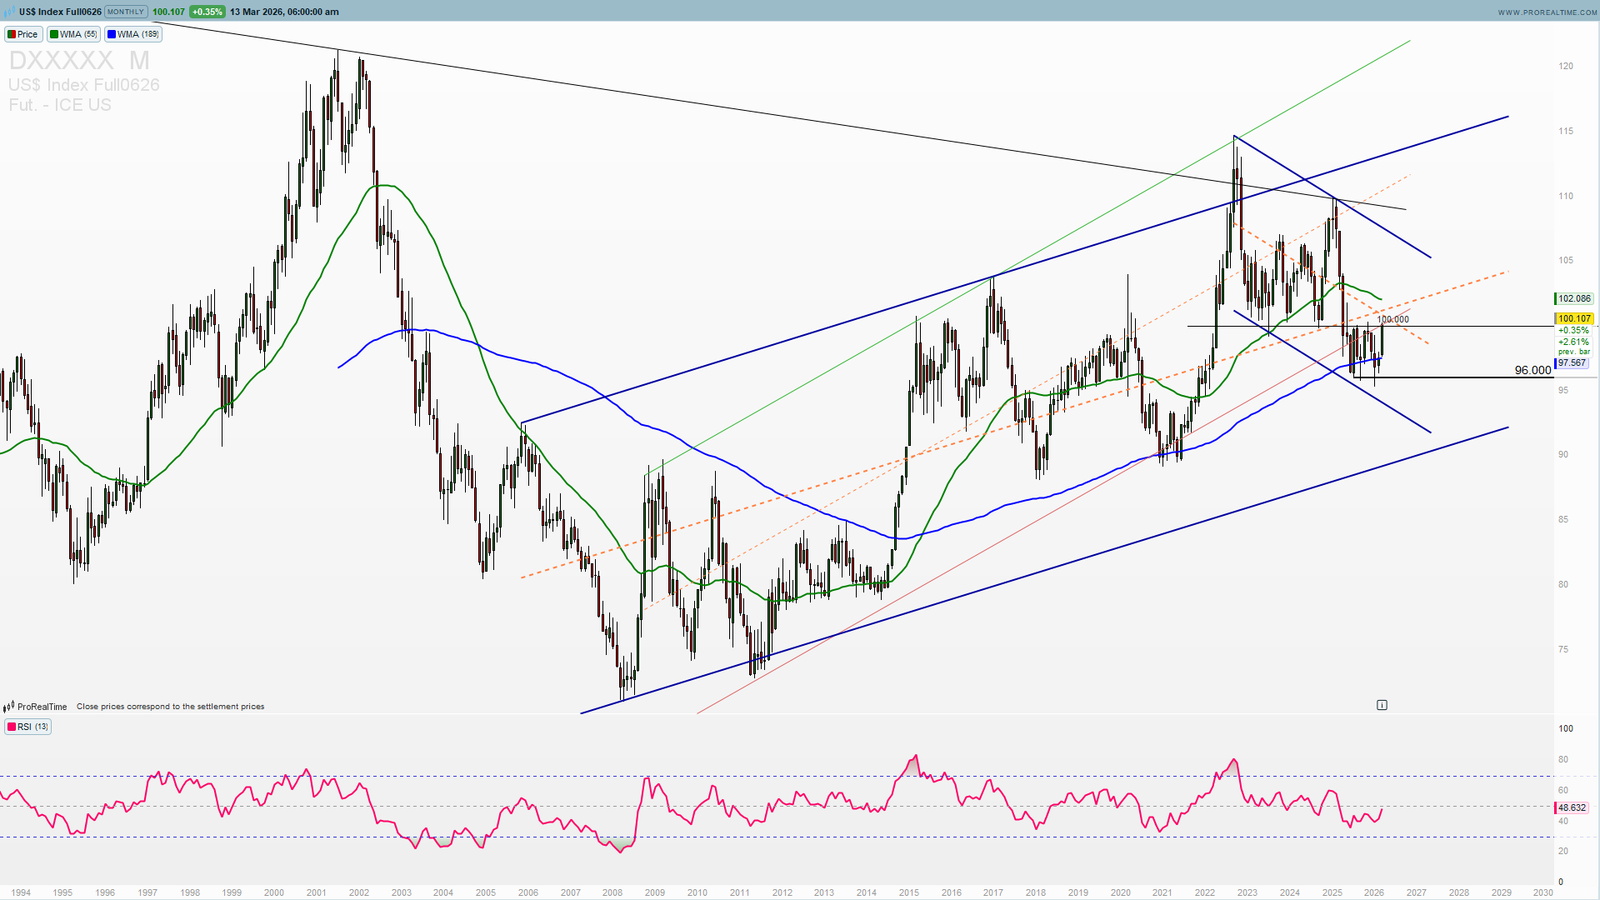
DXY is still in the long-term sideways range
DXY is bouncing off the 96 support and is reaching again multi month range resistance 100. All of the previous months we had a rejection from here and a slide to lower end of the range. Will it be different now? I doubt as Trump policy so far was a weaker dollar and it will not be changed.
Are we in the third wave lower?
DXY is striking a key resistance zone 100-101 where a strong rejection will lead to an impulsive third wave lower. Traders should prepare for this and a possible consolidation in the multi month range extension. A break above 101 will negate this scenario.
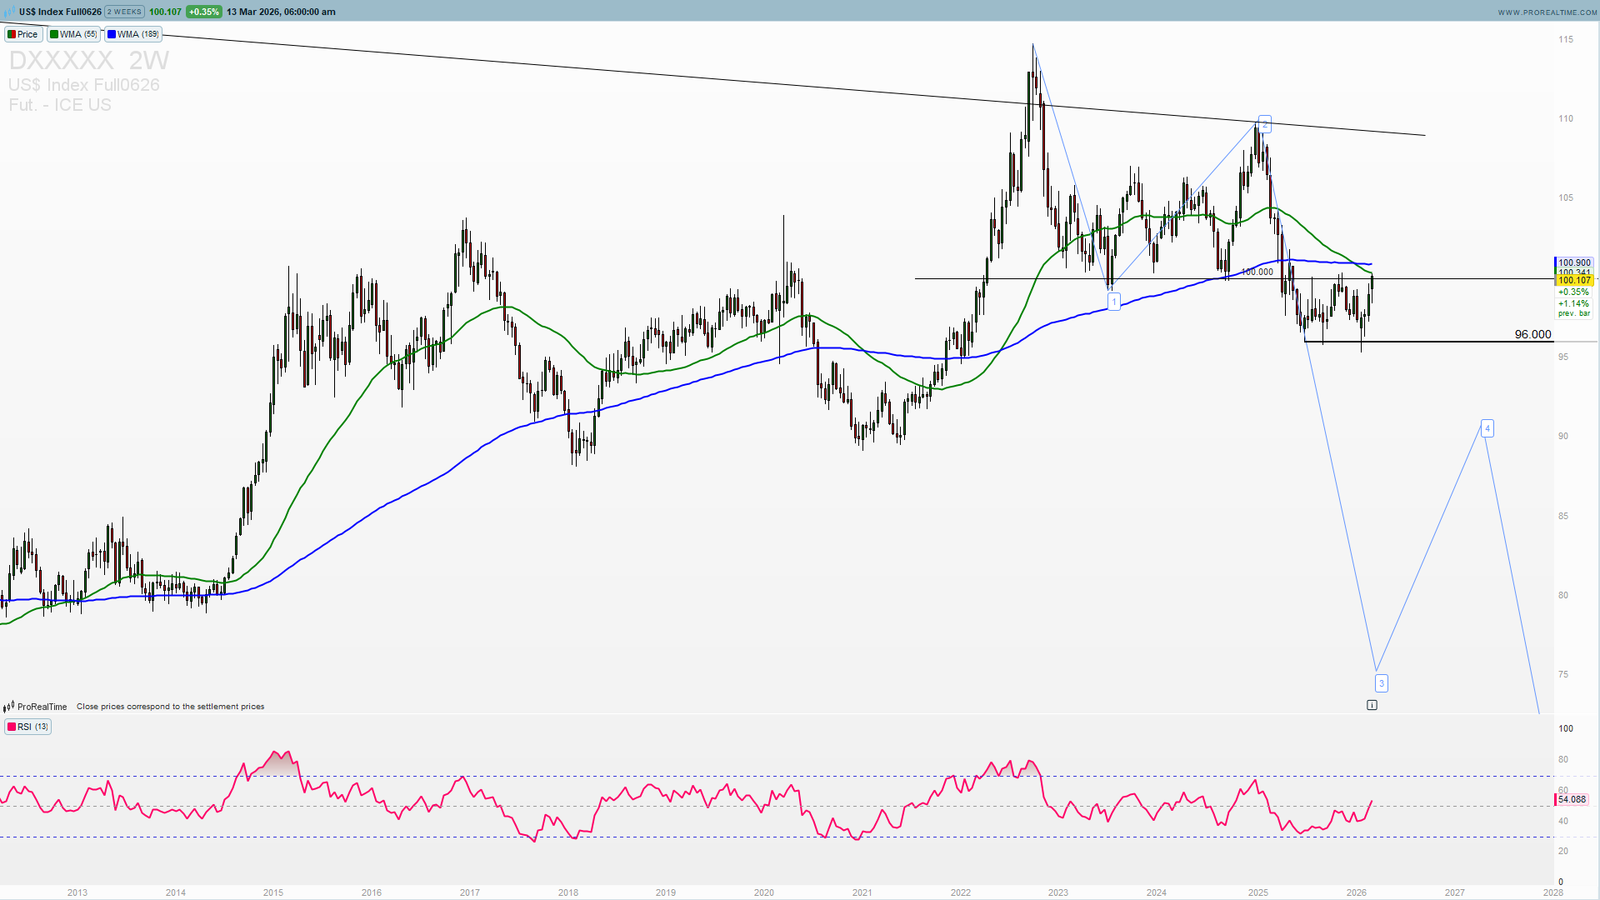
On this weekly chart you can see a strong resistance being tested without a breach so far (join to get premium analysis, weekly and mid-week newsletter and other tools for for your successful trading ). A significant rejection here will lead to a reversal lower in a consolidation range for a 96 test again. You should wait for a rejection or a price action breakout before any action taken here.
Trade this setup with my preferred broker 👇
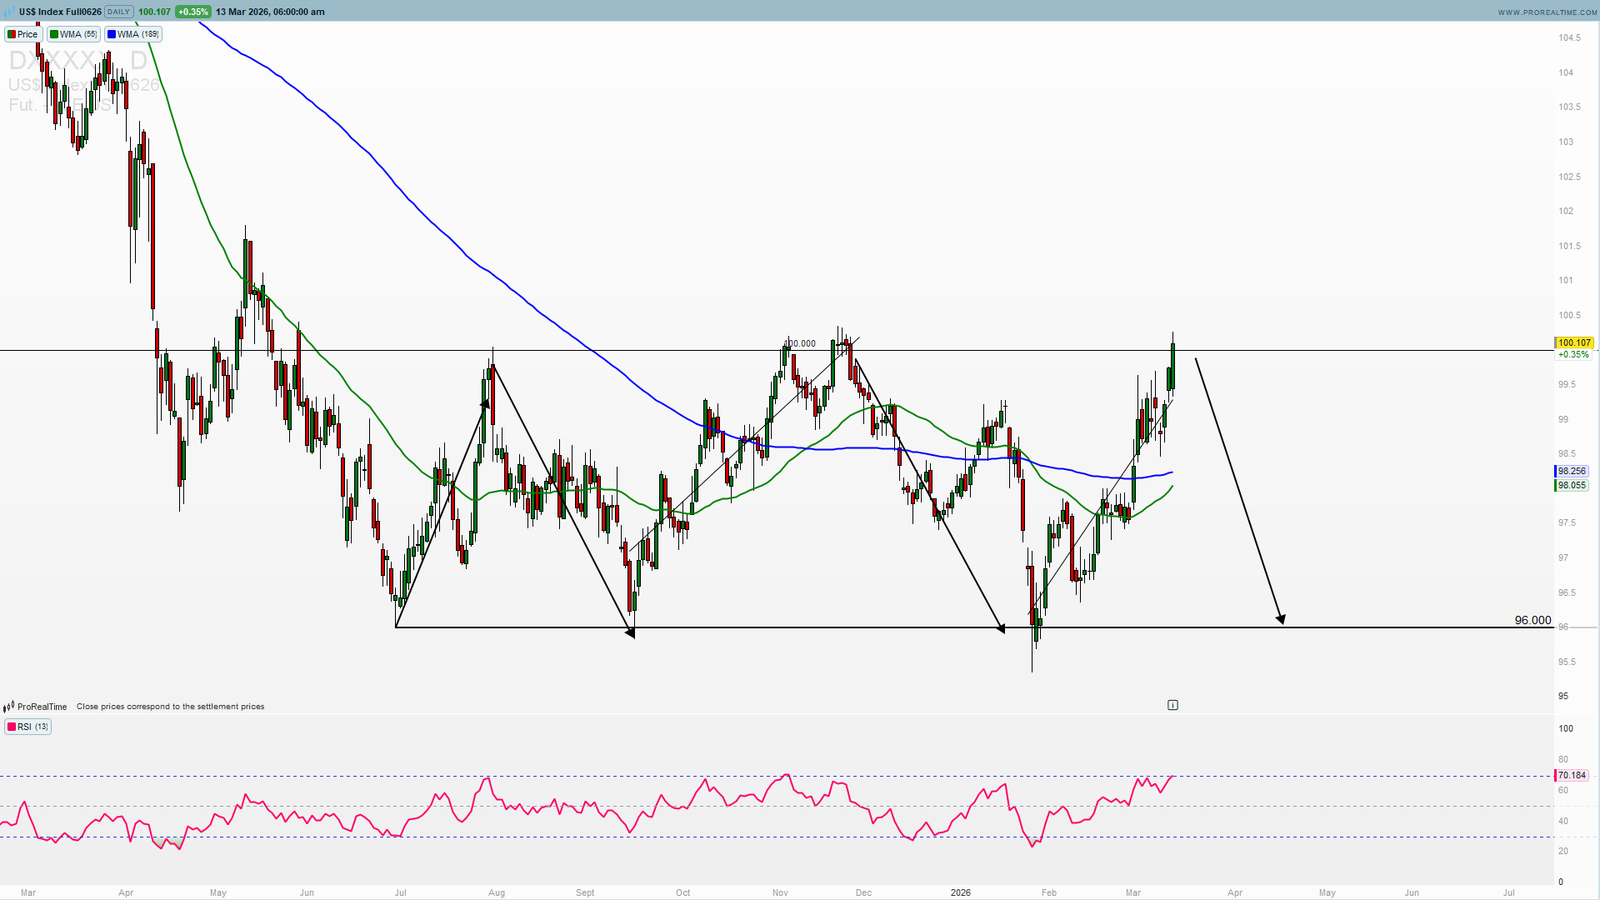
As said on a daily chart the same pattern ongoing from July 2025 is more then visible. My opinion and research is that it will stay in the range once more. Traders that want to exploit this opportunity should find the best possible USD pair that can bring them a nice reward as the risk is minimal with stops just close above 101.
Trade safe!