Fundamental overview
Large “whale” holders (addresses with 1,000+ BTC) are increasing selling pressure as the psychological US$100k threshold is breached.
Marathon Digital Holdings (MARA) announced plans to issue ~US$700 m of convertible bonds to further expand its BTC treasury (already >27,000 BTC).
Meanwhile, Strategy (Inc.) (formerly MicroStrategy) is continuing accumulation of Bitcoin: 43,415 BTC were moved across more than 100 addresses in one recent day (~US$4.26 bn at current prices).
On the flip side, retail & ETF flows are negative: outflows from US spot BTC-ETFs and weak demand have exacerbated the pull-back.
Tech sector overview
| # | Catalyst | Why it matters | Date / Timing | |
|---|---|---|---|---|
| 1 | Q4 earnings season ramp-up for large tech firms | Company results often change forward guidance, capex, headcount and margin assumptions. | Jan 2026 (for many US firms) but quarterly cadence ongoing. | |
| 2 | Upcoming earnings of major tech names (cloud, AI, hardware) | Firms tied to AI/cloud/hardware are leading indicators of the tech cycle turning or stalling. | Rolling weekly: use earnings calendars (e.g., Nasdaq/Yahoo). | |
| 3 | EU Artificial Intelligence Act enforcement start-up | The Act began but many of the tougher provisions (especially for general-purpose AI models) become enforceable in upcoming years — regulatory risk for AI-heavy firms. | Some parts enforceable from 2 Aug 2025 and later. | |
| 4 | Cyber Security and Resilience Bill / UK cybersecurity regulation rollout | UK is tightening rules on tech/data-centre/security operations. Firms operating in UK/Europe will see cost/compliance impact. | Ongoing legislative progress (some deadlines upcoming). | |
| 5 | Supply-chain / memory/chip demand cycle inflection | Memory and semiconductor demand tied to China and global tech hardware upgrade cycles – a potential leading indicator for hardware firms. (contextual market note) | Coming quarters (watch chip earnings). | |
| 6 | Talent/headcount dynamics in tech (entry-level hiring trends) | With automation/AI replacing many entry roles (e.g., UK tech sector cutting graduate intake), margin and growth assumptions shift. (see earlier news) | Ongoing; next annual reports will show headcount metrics. | |
| 7 | UK’s review of tech licensing & competition framework | The Competition and Markets Authority (UK) is proposing to replace the TTBER for tech licensing deals — signaling regulatory change that may impact IP/licensing heavy firms. | Target date: TTBER expiry April 2026. Reuters | |
| 8 | Digital regulation timeline in Europe (data, platforms, AI) | Europe continues to roll out rules regarding platforms, data processing, AI models and digital services — can affect competitive landscape and cost base for tech firms. | Various deadlines: several by 2026. | |
| 9 | Big tech capex and AI infrastructure spending disclosures | Firms are now showing large spend on AI infrastructure (which has earnings implications) – e.g., capex commitments may pressure free-cash flow. The Times of India+1 | As disclosed in upcoming earnings. | |
| 10 | Macro/China demand risk for tech hardware and supply chains | The exposure of tech/hardware firms to China demand (and geopolitical risk) remains a catalyst for earnings surprise and valuation derating. | Ongoing; monitor trade policy, demand indicators. |
No 1 risk for the crypto and stock market
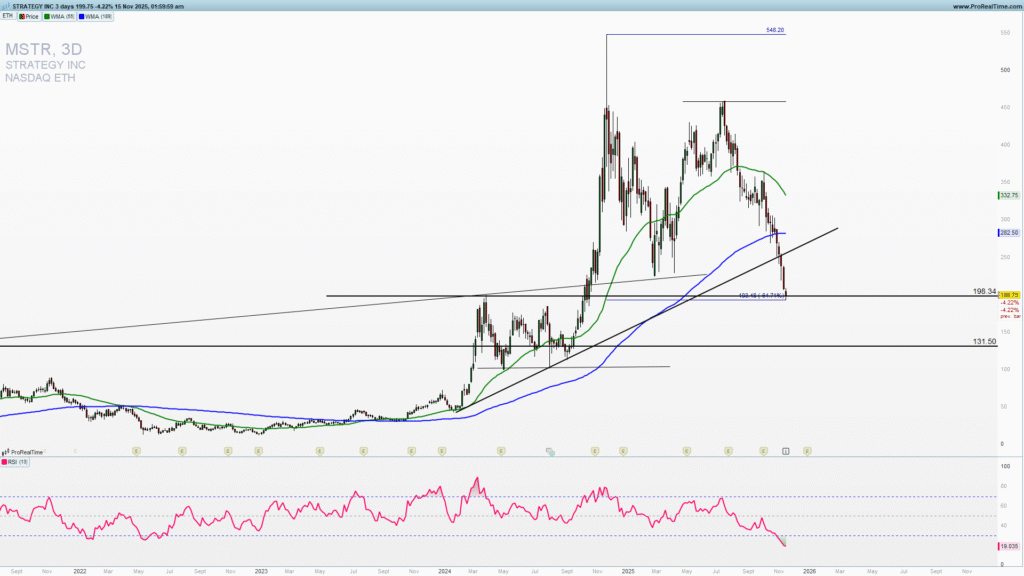
MSTR a company that whole ”strategy” is buying and holding Bitcoin has lost 64% in less then a year from its peak on November 20, 2024. Downside could continue and 100-130 zone. The danger lies in the average price of their Bitcoin holding which is around 75000. The whole ”strategy” was financed by bonds (meaning debt). If the Bitcoin continues lower it will send some liquidation waves across the financial sector.
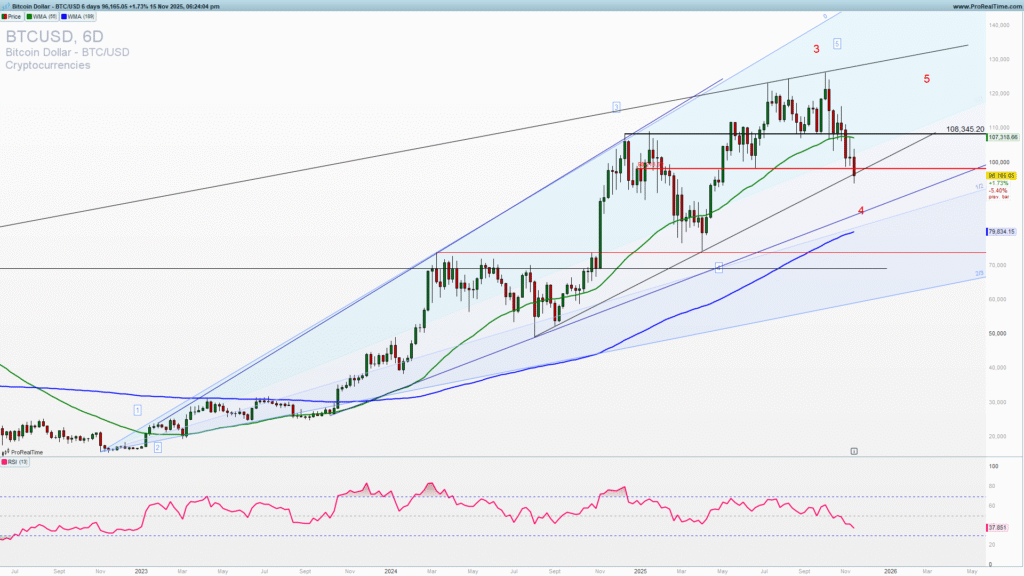
Bitcoin downside continuation?
Bitcoin broke below 100k recently wit a confirmation. This means that the next support that could be reached is 80000. This level is so close to MSTR average buying price.
RSI on 6 days chart shown below is far away from being oversold and a strong downside resistance of 97000 has been broken on Friday November 14, 2025.
I am still holding the short trade from 112000 which has been published to premium members as well (join to get premium analysis and everyday updates). 75000-80000 zone is ultimate short target and a possible major long-term buying zone.
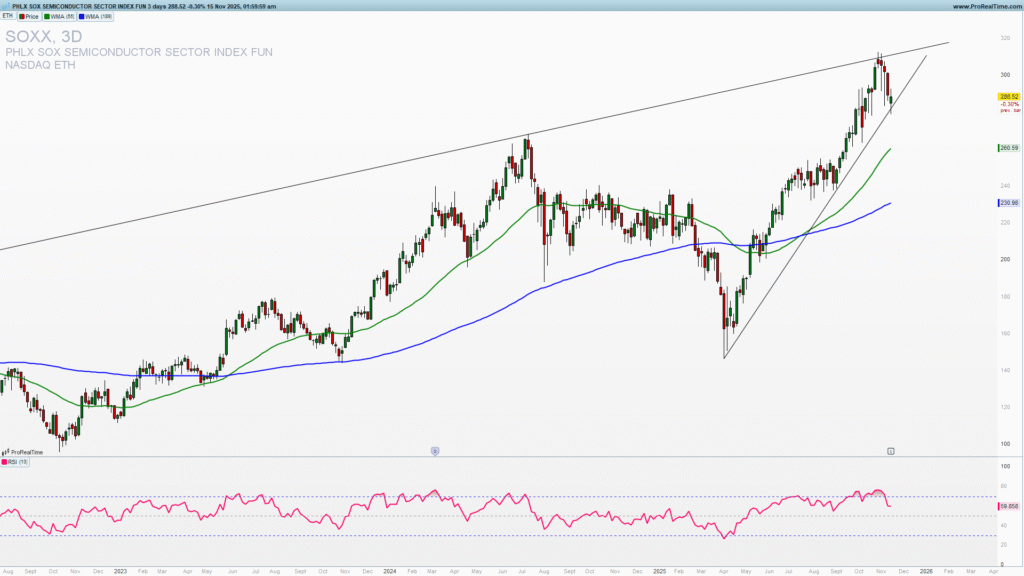
Tech sector doubts
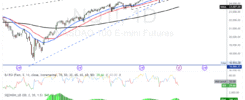
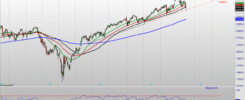
Tech sector has been hit recently with doubts about revenue growth sustainability which is in danger from high operational costs. This of course puts recent stocks valuation in perspective. We can come to a conclusion that is to high and that a correction is needed. SOXX ETF that largely tracks high technology and semiconductors sector reached the high on November 3, 2025 and has been falling since. It is testing the most important support 278 level now. A break below would open a 240 test.
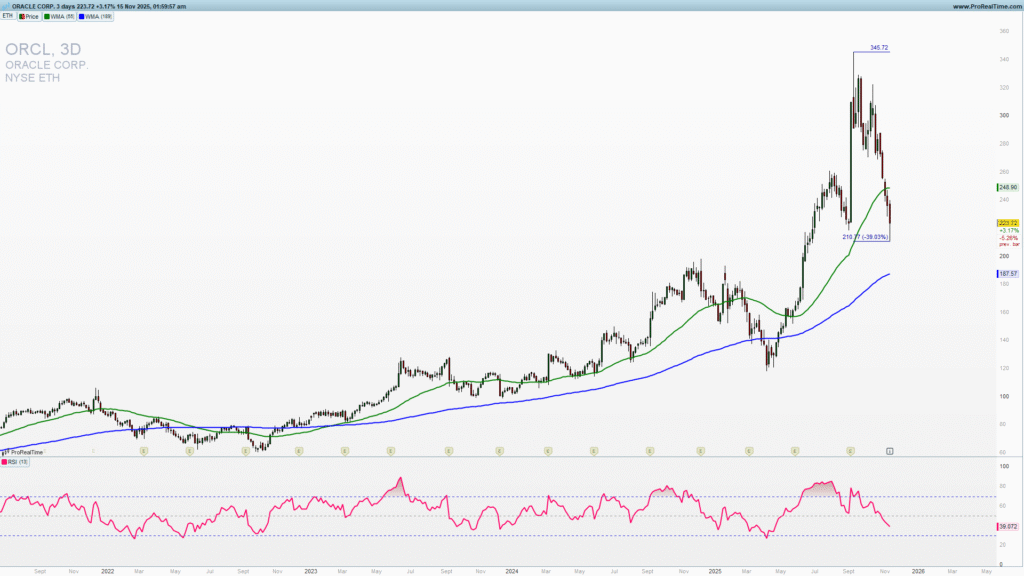
ORCL is another big warning of the stock market bullish continuation. It has lost 34% in just two months. CDS on the Oracle jumped from 60 to 102 points in just two weeks indicating problem with financials and debt. ORCL become United Health of the tech sector and implosion of its debt structure could demolish tech sector and the banks financing them (Softbank for example).