Ethereum fundamental overview
Ethereum is at a pivotal juncture. With ETH drifting near US $3,300 and key support zones under pressure, it is grappling with a tug-of-war between structural upgrades and waning institutional flows. On one side, whale wallets have scooped up some US $1.37 billion in ETH over the past few days — a clear indication that large actors believe the current dip may be an opportunity. 99Bitcoins+1 On the other side, spot ETH-based ETFs are bleeding out, with withdrawals exceeding US $200 million in a single day and six straight sessions of net outflows—raising serious questions about near-term demand. Coinfomania+2crypto.news+2.
Compounding the sentiment mix is the upcoming technical catalyst: the network’s Fusaka upgrade—scheduled for early December—expected to materially enhance data availability and throughput via the Blob-only fork and Peer Data Availability Sampling (PeerDAS). Crypto Economy+1 Meanwhile, on-chain metrics show ETH’s ecosystem processing a record ~24,000 transactions per second, helped by Layer 2 scaling platforms — a sign the throughput narrative is moving into execution mode. TradingView
For market participants, the key questions now are: will the upgrade narrative and accumulation activity offset the weak ETF flows and risk-off macro backdrop? And is the current consolidation phase merely a pause ahead of a breakout — or the precursor to a deeper corrective leg? With ETH’s price structure showing increasing fragility, positioning ahead of the Fusaka hard fork and the next institutional flow cycle may be decisive.
Technical levels analysis
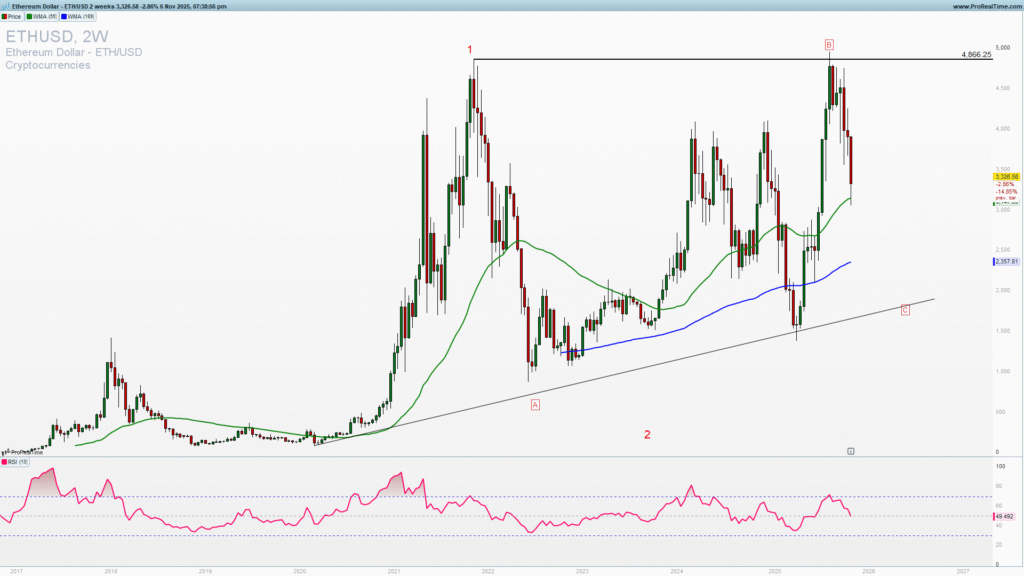
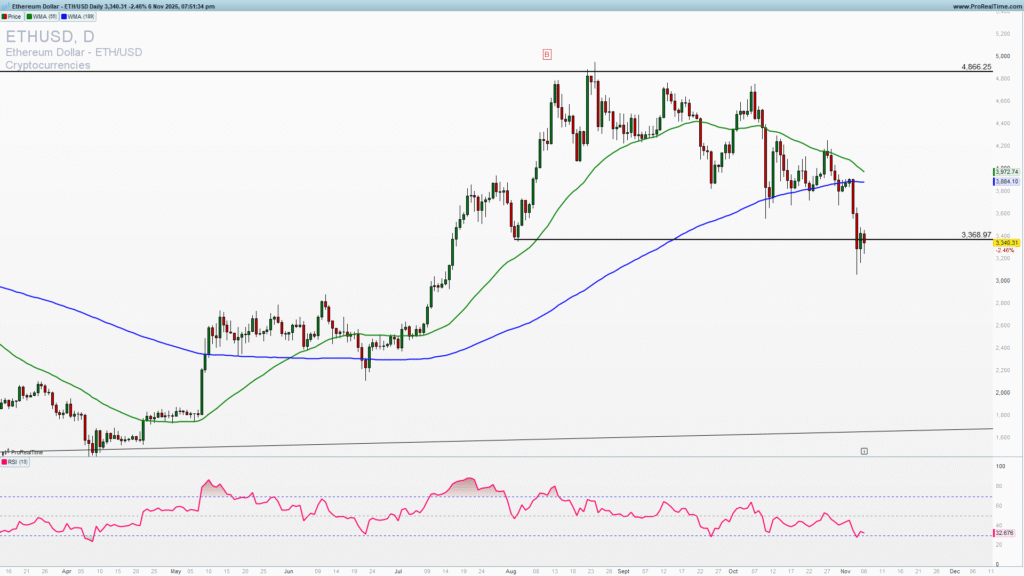
Ethereum reached 4886 level which was the top of the long-term consolidation ascending channel. Marked (B on the two weeks chart). This produced a correction lower and we are at the middle of the consolidation triangle. As we move forward focus shift to 2000 if we get a confirmation break below 3070.
Downside continuation?
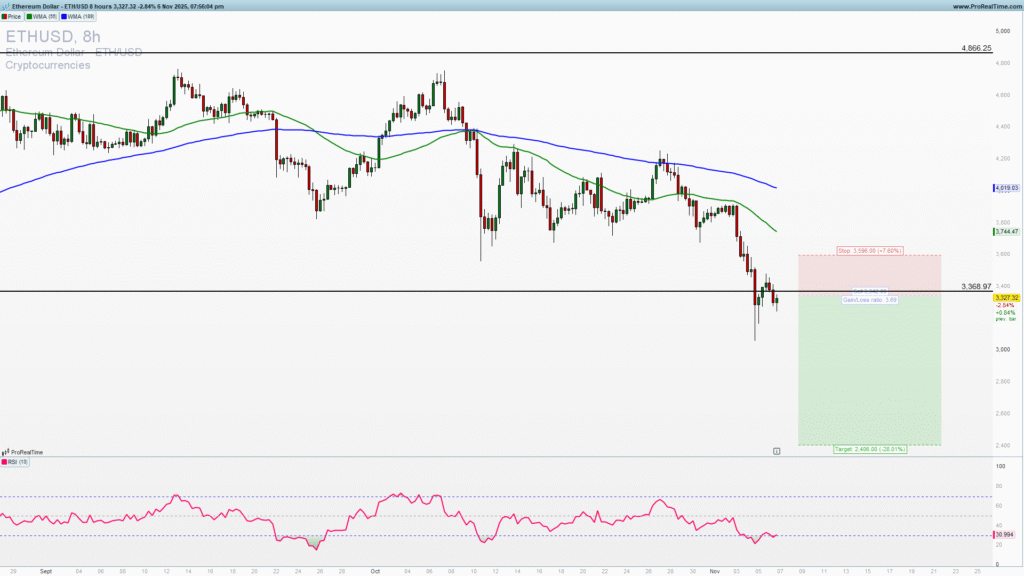
Since the rejection from a top Ethereum is reversing lower hard. We got a breakout below important upside support 3368. If this breakout would be confirmed in the days to come we will see a strong acceleration lower.
Worrying sign is the absence of significant buying at these strong support levels. Every bounce is being sold swiftly which is a sign of the bull market exhaustion.
As long as the 3900 level is holding I will look it as the top at this point and look for the short trade entries to target consolidation triangle support. I would wait for a long trade entries in the zone between 1700-2000 zone (join to get premium analysis and everyday updates). This is a wave C of the long-term consolidation as Ethereum lacks clear trend like Bitcoin has.
Let’s open a low risk short trade!
Looking at the 8h chart, and taking into an account all the momentum, price action and waves along with quantitative data my preferred strategy is short trade. You can take short trade with the stop close and just above 3500 on this short-term consolidation pattern. There is a possibility of an extension lower and in that case take half or the 2/3 of the position and release the rest risk-free!