Fundamental overview
The Silver Institute’s World Silver Survey highlights a second-highest deficit in 20 years, with industrial demand rising 9% in 2024 to record levels. This is fueled by applications in solar panels, electronics, and green energy technologies.
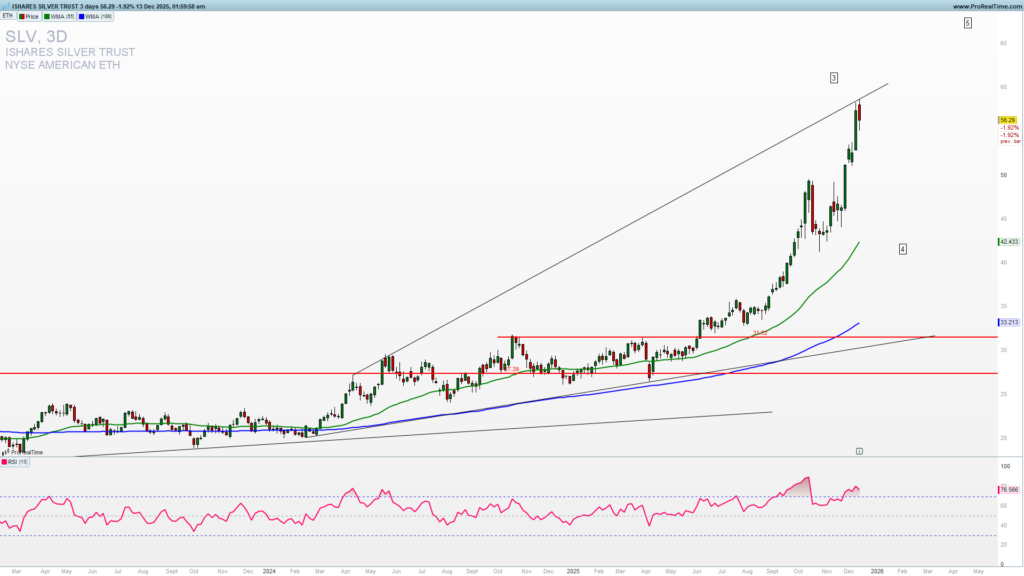
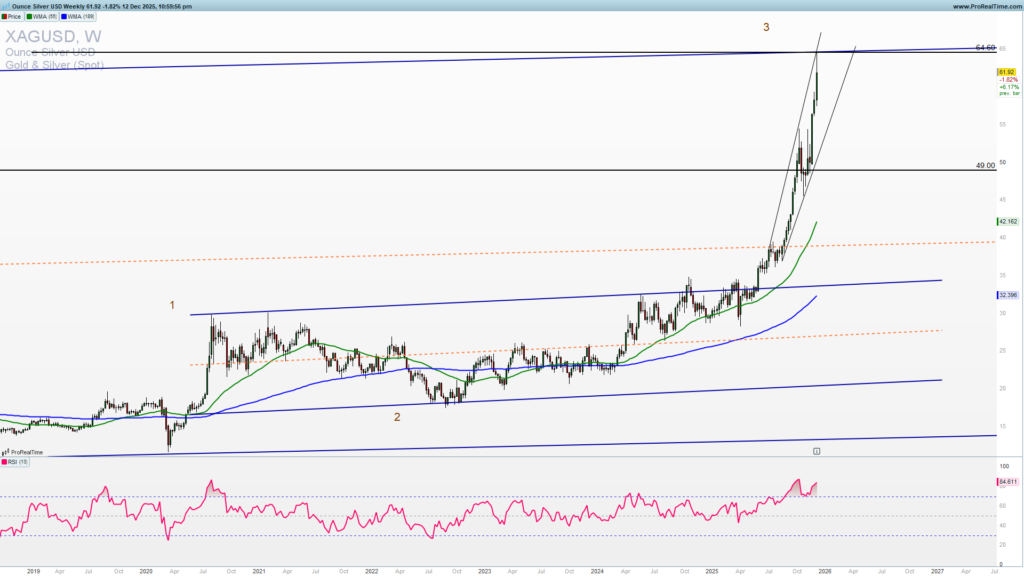
Is Silver overbought?
Silver reached 64.60 level and it is up 32.56% in the period of the last three months. The RSI is almost as high as it was at the previous top on April 2011. Is it overbought? Yes it is. For many analysts the reason behind this rise is the easing cycle of the FED. But is it? The parabolic rise came from a combination of increased industrial demand and FOMO (fear of missing out) buying by retail traders.
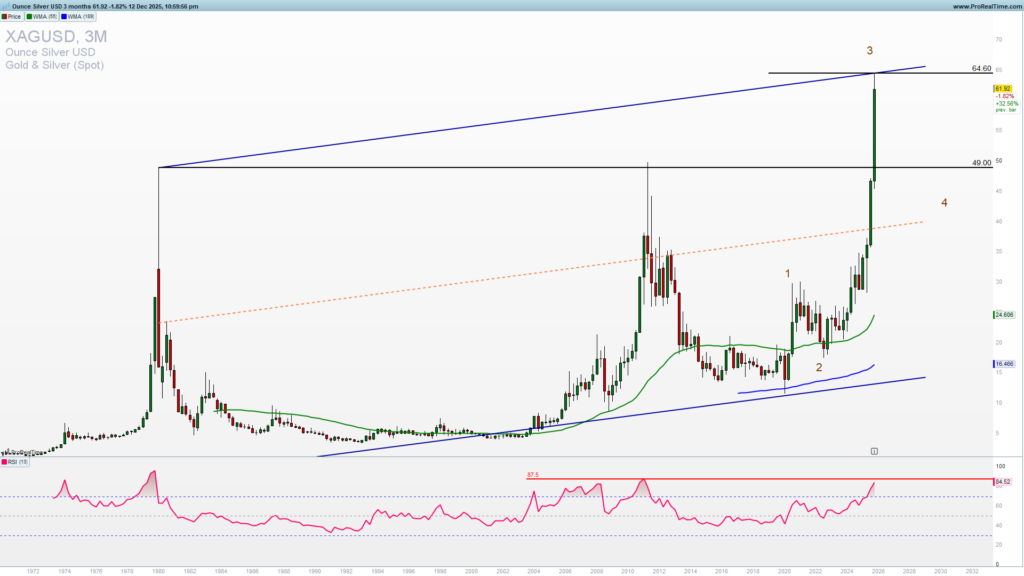
Weekly chart reveals the strong resistance and a medium-term broadening wedge for Silver. A rejection here is calling for a much needed pullback after the three weeks amazing upside run. Pullback could lead to a test of 54 which is the uptrend and a broadening wedge support. FOMO buying at these levels instead of waiting for a pullback can lead to big loses. If Silver breaks below 54 and goes to a deeper pullback which is not excluded if we look at the price action through the years we can see a test of 35-40 zone.
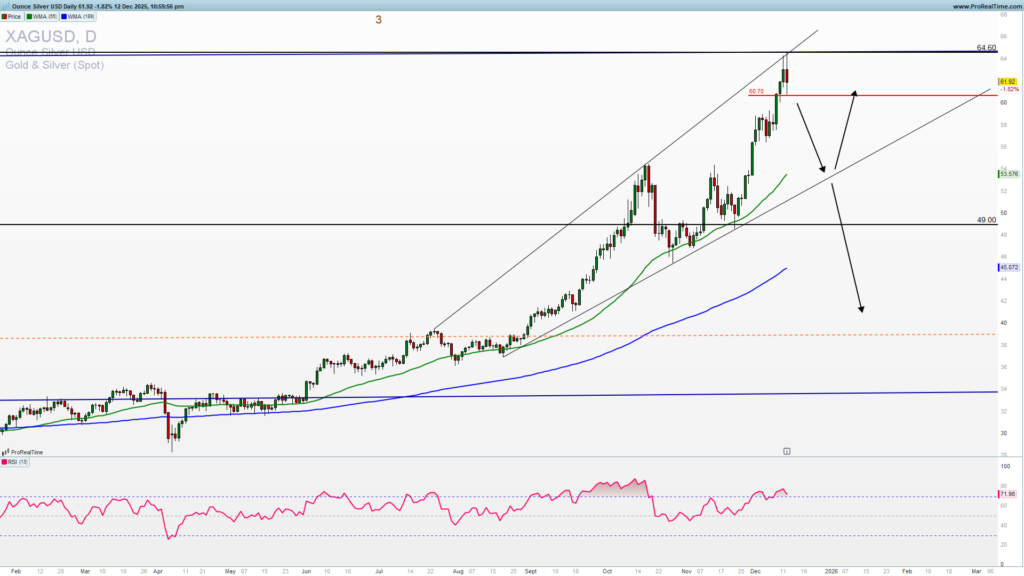
Two days of the rejection from 64 (join to get premium analysis and everyday with a free prop trading challenge account from partners) indicates a weakness of the uptrend. If we get a break below 61 we can see a downside continuation to an indicated level of support 54.
A break above 64 will leave most of the traders aside as will expose Silver to a very volatile reversal down in a bigger swings. RSI is not so overbought as it was, but it is showing a big negative divergence as it is significantly lower than the October peak despite the price parabolic increase. I am sure that Silver bulls want more profit and a fast hyper jump to 80 from here, but that is not a natural structure of the market and could lead to a great distortion.
Finally a SLV ETF is reaching a strong resistance and is fairly overbought with a big gap up from the moving averages, something that traditional ETF investors see as a top and sell to protect their positions and take profit.
Trade safe!