• Home
  • Features
  • Live trading results
  • Blog
  • Dashboard
  • PST Terminal
  • Stocks Dashboard
  • Contact
February 1, 2026 by TraderNomad

Is Oil The New Gold?

Is Oil The New Gold?
February 1, 2026 by TraderNomad

Table of Contents

Toggle
  • Is Oil the New Gold? Navigating a Breakout Week in Energy Markets
  • USO ETF is reviving
  • Oil is testing the first important upside resistance

Is Oil the New Gold? Navigating a Breakout Week in Energy Markets

Crude markets surged dramatically, with **Brent crude breaking above $70 per barrel and posting multi-month highs as escalating geopolitical tensions between the United States and Iran injected a sharp risk premium into prices, even in the absence of actual supply disruptions. Headlines around potential U.S. military actions and an increased naval presence near the Strait of Hormuz prompted traders to price in the specter of supply interruptions from one of the globe’s most strategically vital oil corridors.

At the same time, OPEC+ is signaling continuity rather than expansion, with producers eyeing a continuation of the output pause into March — underscoring a deliberate balancing act between supporting prices and managing seasonal demand dynamics.

Even against this backdrop of elevated geopolitical risk, underlying fundamentals remain mixed. While the International Energy Agency (IEA) has nudged its global demand growth forecasts higher for 2026, a sizeable supply surplus and inventory builds still temper the upside — reminding markets that crude’s ascent isn’t purely structural.

This week’s clash of risk-on headline trading and evolving supply-demand signals begs an important question: Is oil going to explode higher and become a new Gold?

USO ETF is reviving

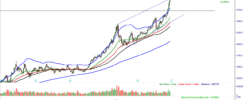
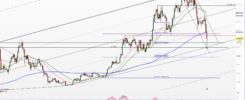
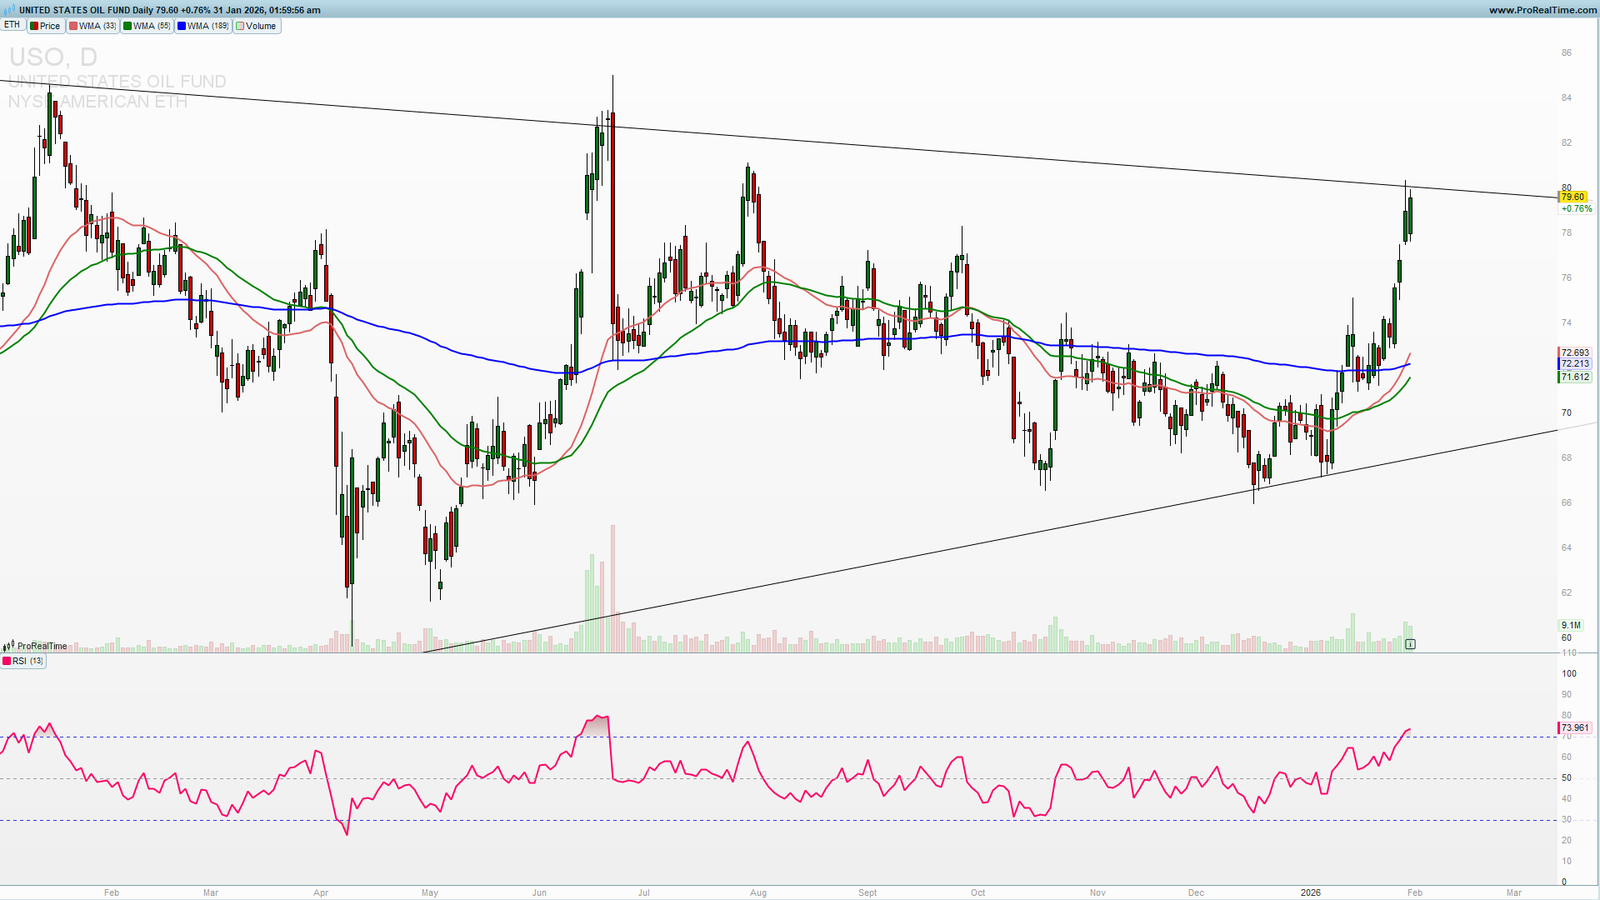
USO ETF felt during the years and is in the consolidation basing triangle with a major resistance 80 now being tested as the Oil prices rising in the last week. Volume is also rising as we can see on a daily chart and this looks like a Gold consolidation and buying pressure that led to a parabolic rally to the upside. By comparing those two we can draw some parallels which are pointing to a new energy rally which you do not want to miss.
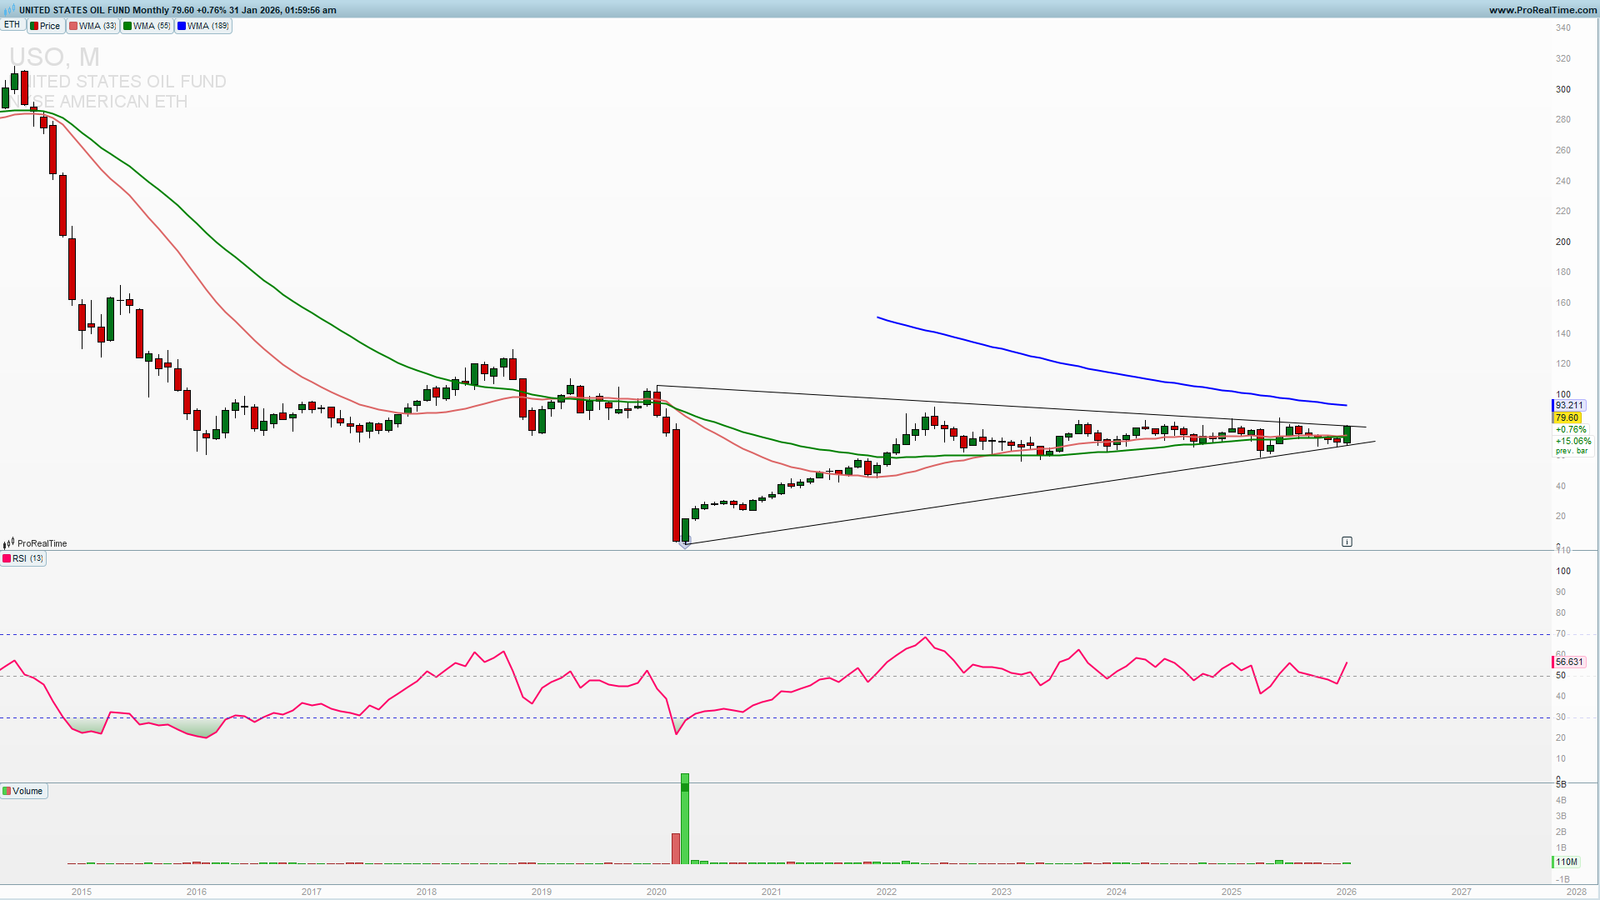
USO monthly chart
USO ETF monthly chart
USO ETF Daily chart
USO ETF Daily chart

Oil is testing the first important upside resistance

Oil bounced from 55.75 and rallied higher into a strong first resistance. This is a downtrend line and a horizontal resistance 68.300. A break above this resistance will open 75 which is the second most important resistance on the way higher. Next week we need to see a breakout above the 68.300 with a strong daily close to confirm an escape from a multiyear consolidation like Gold had.
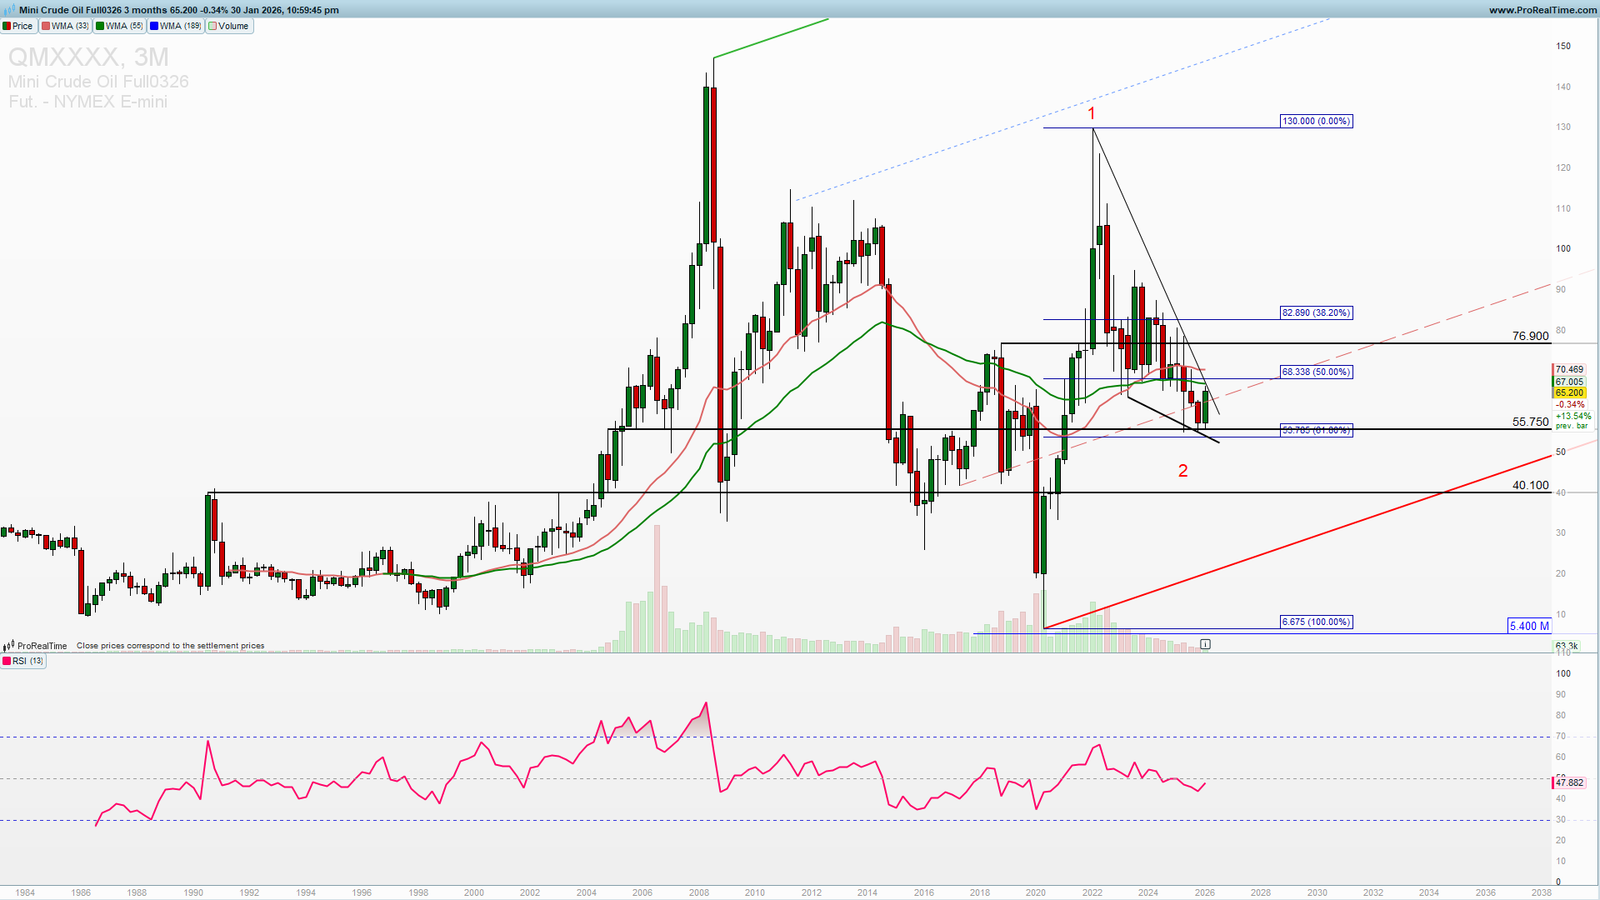
Oil three months chart

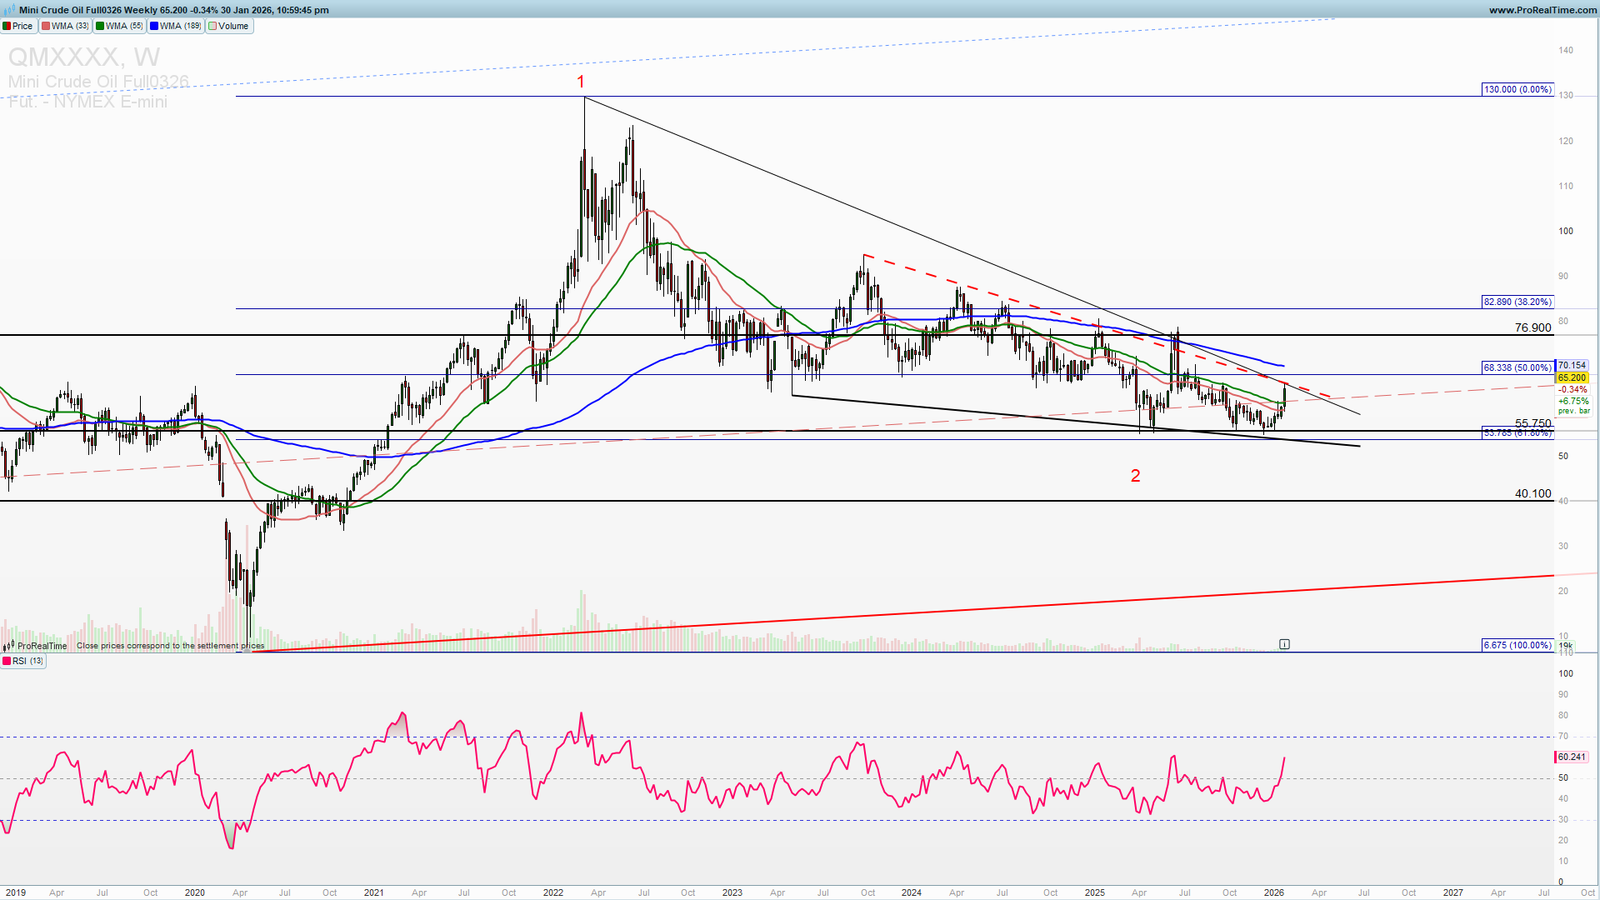
On the weekly chart you can see a strong cluster of the resistance (join to get premium analysis, weekly and mid-week newsletter and other tools for for your successful trading) indicated on the long-term chart. You can see that the price action in the declining wedge so squeezed for weeks and the major move is ahead.

Trade this setup with my preferred broker 👇
Open a Trading Account


Oil weekly chart
Oil weekly chart


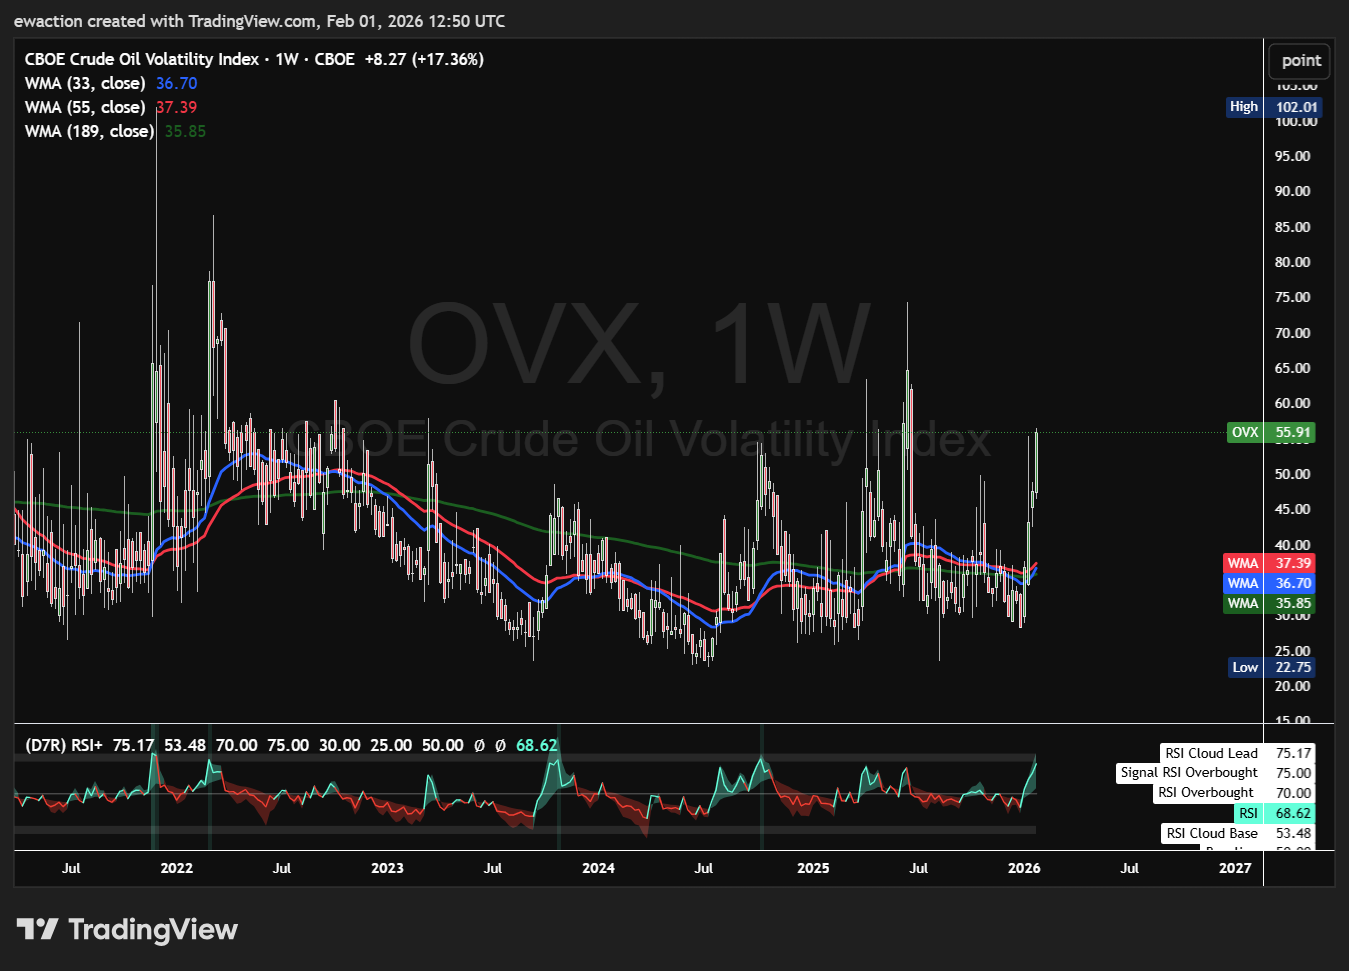
Friday indecision candle is just a pause before a possible brief pullback before another final attack on 68.300. This is the breaking point and a confirmed daily close above this level will lead to a strong continuation higher and a Gold look a like move which came from a years of consolidation. Oil price was pressured during the Russia Ukraine war by administrative measures that targeted the Oil international trade but the volatility is coming back as you can see on the OVX Oil volatility Index chart.
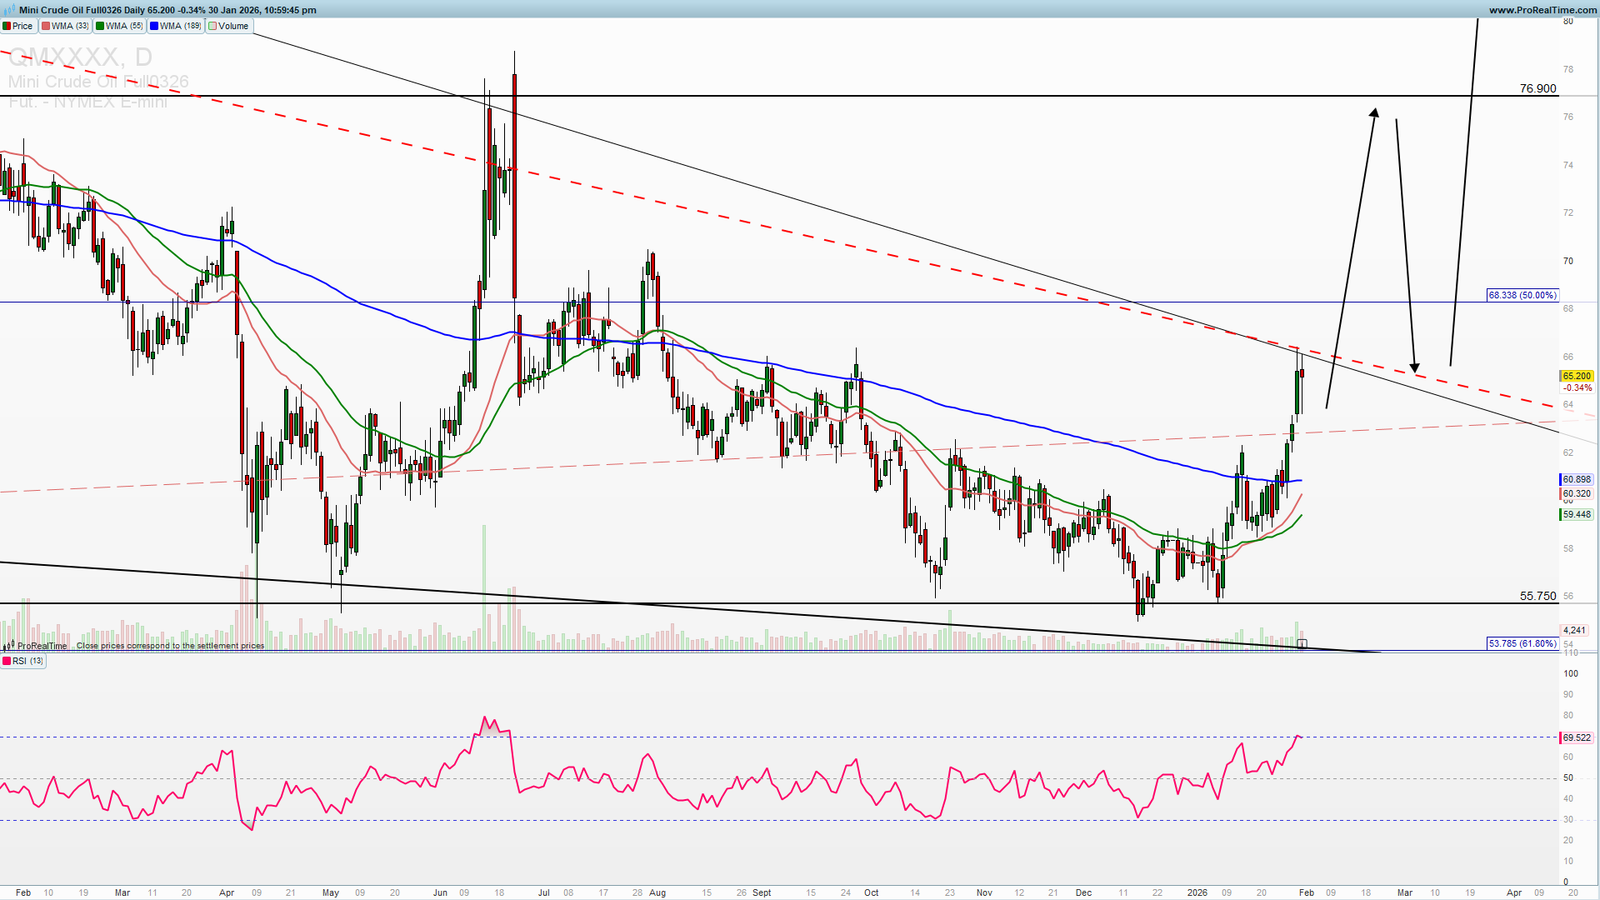
Oil daily chart
Oil daily chart
OVX Oil volatility
OVX Oil volatility

You can use the possible pullback early next week for a buying opportunity.


Get Access to Trade Setups

Trade safe!


Previous articleGold and Copper Market OverviewGold daily chartNext article Is Bitcoin More Attractive Than Gold in 2026?Bitcoin weekly chart

Leave a Reply Cancel reply

Your email address will not be published. Required fields are marked *

Premium and free trade analysis articles

Recent Posts

Ethereum Bullish Setup Surges Toward Critical $2,500August 22, 2026
Nasdaq100 Reversal: NQ Rejected at 15-Year Channel Top 2026August 16, 2026
XAGUSD Bullish Reversal: Silver Breaks $67.40 Toward $80August 8, 2026

Categories

  • Trade analysis

Tags

August 2026 Bearish Breakdown Bearish Setup Bearish Stocks 2026 Bitcoin Bitcoin Analysis 2026 Bitcoin Elliott Wave Bitcoin Price Prediction Bitcoin Sup BTC June 2026 BTC port Levels USD BTC Technical Analysis Crude Oil Elliott Wave Elliott Wave Signals ETF Comparison GLD Analysis GLD ETF GLD Price Target GLD Technical Analysis Gold Buy the Dip Gold ETF 2026 July 2026 Micron Nasdaq-100 NVDA NVDA Elliott Wave NVIDIA NVIDIA Bullish ProSignalTrades ProSignalTrades 2026 ProSignalTrades Review QQQ Rising Channel Semiconductor ETF Semiconductors SMH SPDR Gold Shares SPDR Gold Trust Stock Analysis Support Levels Technical Analysis Trading Research Platform Trading Signals Review WTI

Why PST

15+ years of trading experience — analysis built on real market knowledge, not theory.

Get Started Now!

Contact

info@prosignaltrades.com

Recent Posts

Ethereum Bullish Setup Surges Toward Critical $2,500August 22, 2026
Nasdaq100 Reversal: NQ Rejected at 15-Year Channel Top 2026August 16, 2026
XAGUSD Bullish Reversal: Silver Breaks $67.40 Toward $80August 8, 2026
ProSignalTrades Wordpress Theme. Proudly Built By PST
TOS and Privacy Policy

Recent Posts

Ethereum Bullish Setup Surges Toward Critical $2,500August 22, 2026
Nasdaq100 Reversal: NQ Rejected at 15-Year Channel Top 2026August 16, 2026
XAGUSD Bullish Reversal: Silver Breaks $67.40 Toward $80August 8, 2026