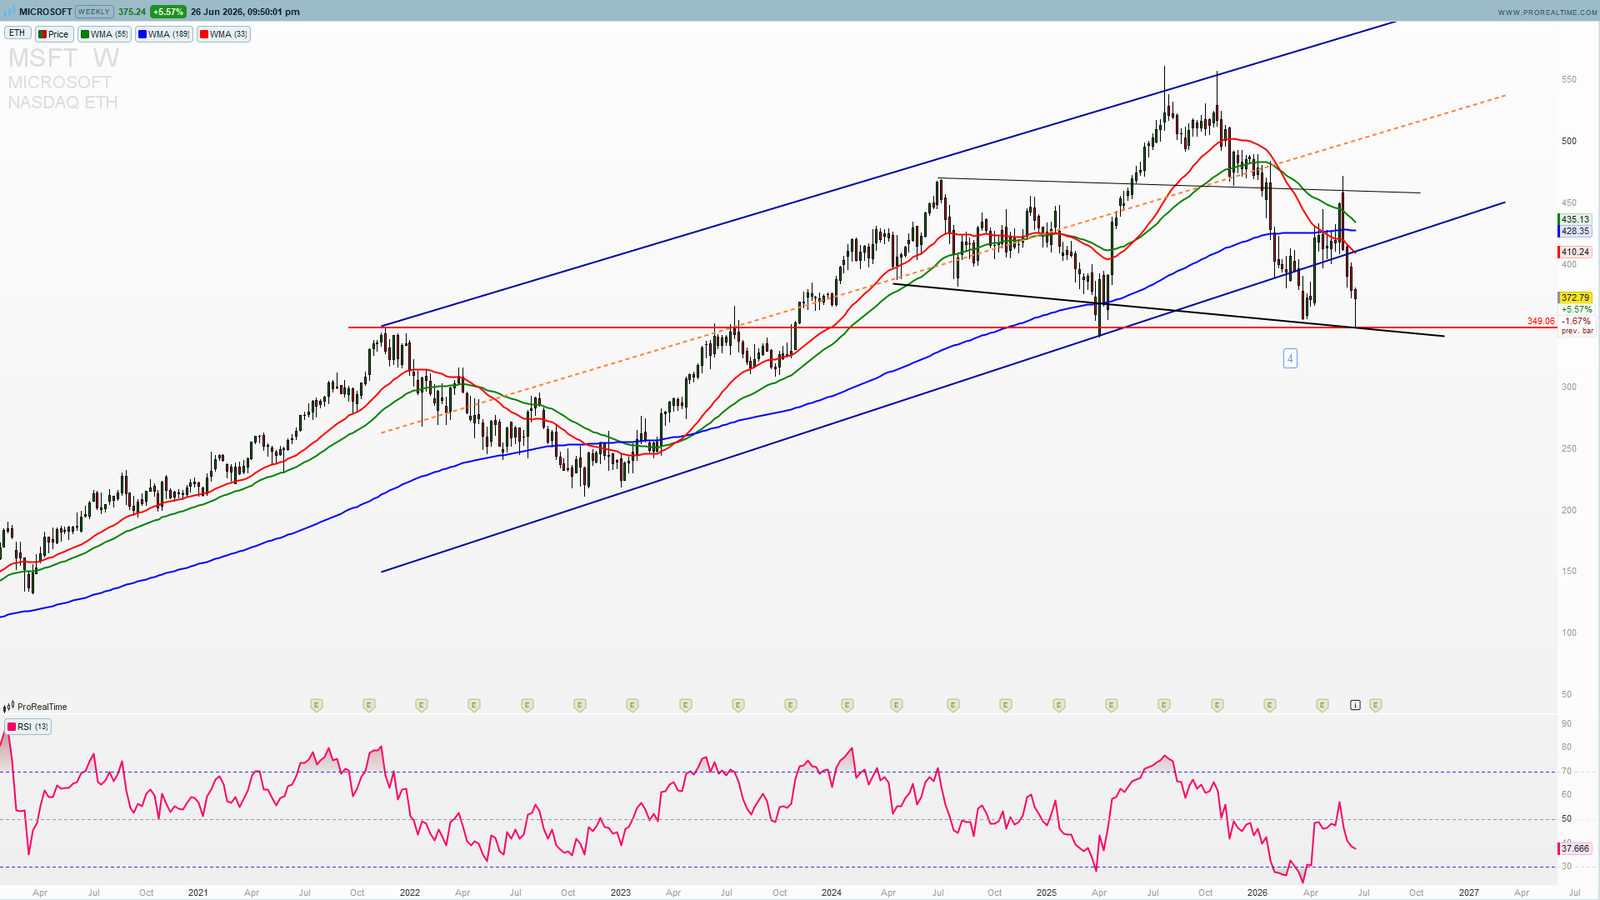
Microsoft stock is printing $372.79 on the weekly chart, and the technical picture has turned decisively bearish. A textbook Head and Shoulders pattern has formed over the past two years, the neckline has already been tested, and price is now in a critical retest zone.
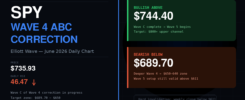
This is one of the clearest reversal setups we have seen on a major tech name in 2026. In this post we break down exactly how to read the H&S pattern, what the measured move targets mean for MSFT, and the one level that would invalidate the bearish case entirely. For broader market context, see our SPY Wave 4 ABC correction analysis and our WTI Crude Oil Wave 3 outlook.
What Is a Head and Shoulders Pattern?
The Head and Shoulders is one of the most reliable and widely-studied reversal patterns in technical analysis. It forms at the top of an uptrend and signals a shift in momentum from buyers to sellers.
The pattern has three components:
Left Shoulder — a rally to a new high, followed by a pullback. Buyers are still in control, but the first sign of distribution appears.
Head — a second rally that pushes above the left shoulder high, creating a new peak. This is the last gasp of bullish momentum before smart money begins distributing in earnest.
Right Shoulder — a third rally that fails to reach the Head high. This is the key tell — buyers tried but couldn’t match the previous peak. Volume typically drops on the right shoulder, confirming the loss of upside momentum.
Neckline — a horizontal (or slightly sloped) line connecting the lows between the left shoulder and the head, and between the head and the right shoulder. A confirmed close below the neckline is the trigger for the bearish setup.
Measured Move Target — the projected downside is calculated by taking the distance from the Head to the neckline, then subtracting that same distance from the neckline break point. This gives traders an objective target rather than guessing.
The MSFT Head and Shoulders — Reading the Weekly Chart
Applying this framework to the MSFT weekly chart, the pattern is unmistakable:
Left Shoulder — formed in mid-2024 at approximately $460-470. Price pulled back to the rising channel support before recovering.
Head — the peak of the entire move, reaching $487.51 (52-week high) in mid-2025. This was the euphoric top driven by AI capex cycle enthusiasm and consensus “buy” ratings across Wall Street.
Right Shoulder — the 2026 rally attempt topped at approximately $475 before rolling over sharply. Critically, it failed to match the Head high — confirming the pattern.
Neckline — the red horizontal line on the chart at $349.06. Price broke below this level, printing the 52-week low at $349.20, before the current bounce to $372.79.
The bounce to $372 is the most important part of the current setup. After a neckline break, price frequently returns to test that level from below — the former support becomes resistance. This is the retest. If it holds, the pattern is confirmed and the measured move targets come into play.
Measured Move Targets and Key Levels
The H&S measurement for MSFT:
Head at $487.51 − Neckline at $349.06 = $138.45 height
Measured move target: $349.06 − $138.45 = $210.61
That is the theoretical full pattern projection. In practice, measured moves are rarely achieved in a straight line — price tends to find support at intermediate levels:
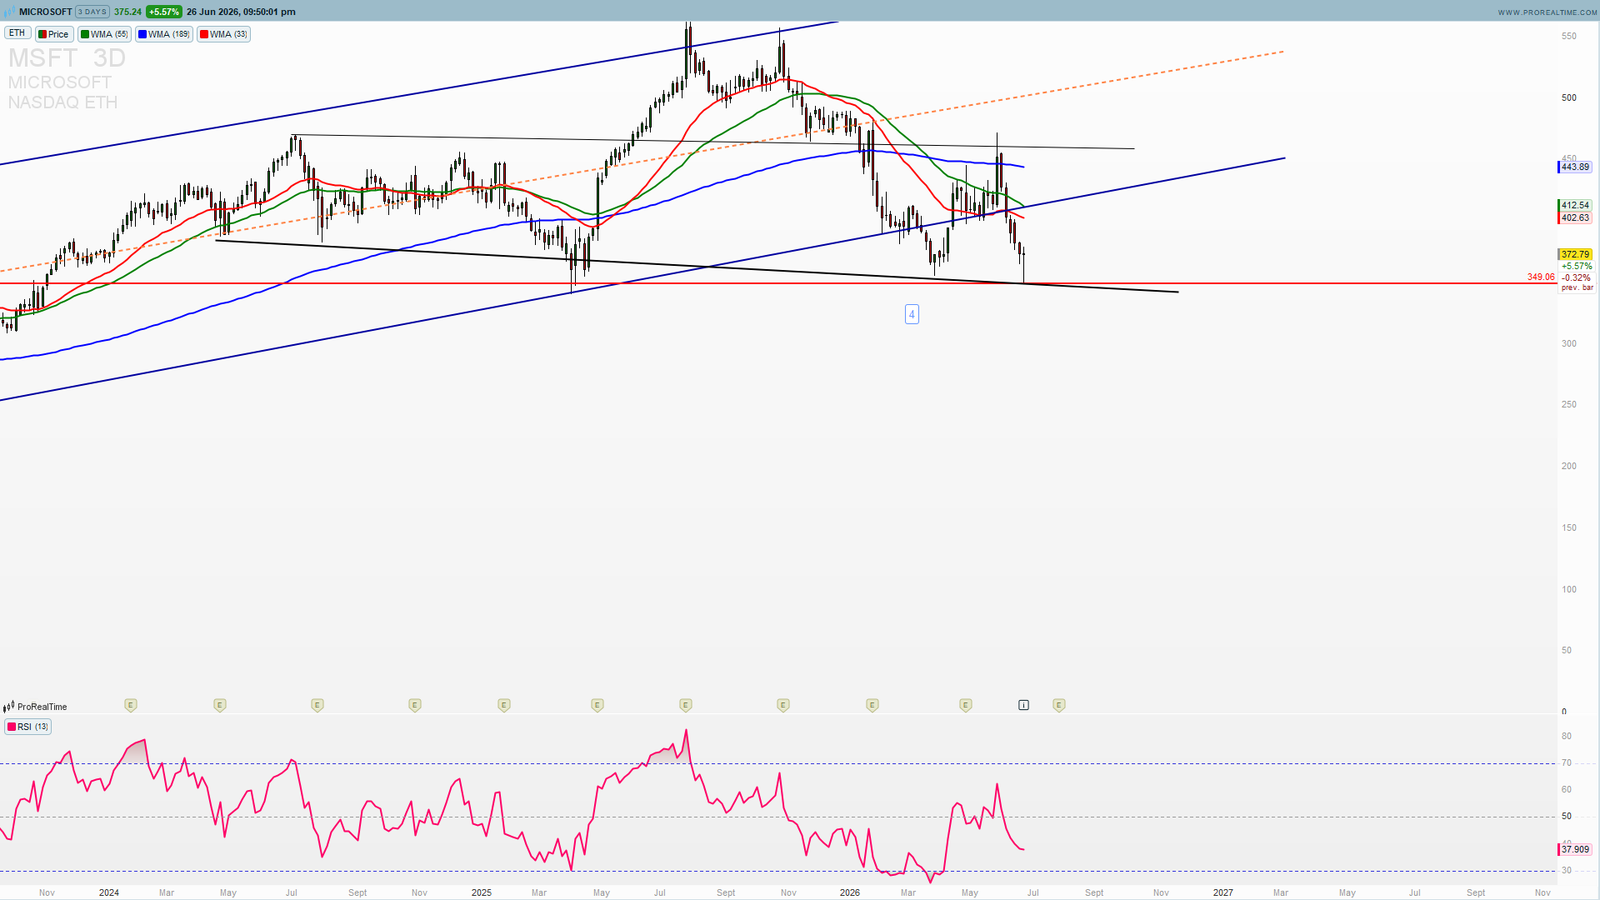
$407.43 — immediate resistance (moving average cluster, visible on chart). A failure here confirms the retest is complete.
$349.06 — the neckline. Must hold as resistance for the bearish case to remain intact.
$300–$280 — first major target. Previous consolidation zone from 2023-2024, strong structural support.
$220–$240 — deeper target. Full measured move zone. Would represent a ~55% correction from the 2025 peak — extreme but within the range of prior Microsoft bear cycles.
Bullish vs Bearish Triggers
✅ Weekly close above $428 → right shoulder reclaimed, H&S pattern invalidated, bullish recovery toward $480+ possible
🟡 $372–$407 rejection → retest complete, next leg down toward $300-$280 begins
🔴 Weekly close below $349.06 → neckline break confirmed, $280 target in play
🛑 Hard invalidation: weekly close above $428 → pattern broken, do not short
Want MSFT trade setups, precise entry/exit levels, and multi-asset signals in real time? Access ProSignalTrades Premium → Use code FIFA30 for 30% off Lifetime plus a shot at a funded account.
Why MSFT Is Vulnerable Right Now — Fundamental Context
The H&S pattern does not form in a vacuum. Several fundamental headwinds have aligned with the technical breakdown:
AI capex cycle reality check. Microsoft’s Azure growth, while strong, has been met with questions about return on invested capital. The market priced in near-perfect AI monetization at the $487 peak — and is now recalibrating.
Valuation compression. At the 2025 peak, MSFT traded at over 35x forward earnings. At $372, that multiple has compressed but remains elevated relative to historical norms, particularly in a higher-for-longer rate environment.
Broader tech rotation. The SPY Wave 4 correction we outlined in our recent analysis is dragging the entire megacap tech space lower. MSFT, as a top-3 S&P 500 component by weight, amplifies index moves.
Options market positioning. Large put open interest has accumulated at the $350 strike — a sign that institutional players are hedged for a retest of the neckline and potentially below.
For live MSFT pricing and fundamentals, Yahoo Finance MSFT page is the most accessible resource. For official earnings and guidance, see Microsoft Investor Relations.
MSFT Outlook — Bearish Retest, Watch $349 and $407
The setup is clear. MSFT has formed a textbook Head and Shoulders, broken the neckline, and is now retesting it from below at $372.
A rejection between $372 and $407 would confirm the retest and open the path toward $300-$280 as the first meaningful target. The weekly RSI at 38.18 is oversold territory but not at the extreme levels that have historically marked major lows — there is room for further downside before exhaustion.
The one scenario that breaks the bearish case: a weekly close back above $428, reclaiming the right shoulder. Until that happens, the pattern is intact and the downside targets are in play.
Access ProSignalTrades Premium for live MSFT wave counts, equity research reports, and real-time signals across stocks, commodities, and forex. Get started here →
—
Disclaimer: This analysis is for educational purposes only and does not constitute financial advice. Trading equities involves significant risk of loss. Always conduct your own research before making any trading decisions.