WTI crude oil is unwinding one of the sharpest geopolitical risk rallies in years. After spiking to a 52-week high of $119.64 on fears of a full closure of the Strait of Hormuz, crude has reversed hard, now trading at $47 and sitting almost exactly below 61.8% Fibonacci retracement of the entire advance.
The question every oil trader is asking: is this the start of a deeper bear trend, or simply Wave 2 of a much bigger bullish structure? In this analysis we walk through the Fibonacci map, apply basic Elliott Wave theory to the current pullback, and lay out the levels that will decide the next move. For context on how we’re approaching the broader macro picture this month, see our Gold XAUUSD key level analysis and our Bitcoin BTC/USD outlook.
WTI Market Structure — The War Premium Unwind
The rally that took WTI from the high-$55s to $119.64 was driven almost entirely by a geopolitical risk premium tied to the Strait of Hormuz. With production outages reportedly exceeding 11 million barrels per day at the conflict’s peak and tankers stranded outside the strait, the market priced in a genuine supply shock.
That premium is now unwinding quickly. An interim US-Iran agreement has allowed shipping to resume, with tens of millions of barrels reported moving through the strait again and Kuwait signaling it will lift production. Crude has shed roughly 10% in a single week as a result, and the daily chart shows the damage clearly: price sliced straight through the 23.6% Fib ($104.43 ) and the 38.2% Fib ($95.02) before stalling almost exactly below 61.8% retracement at $79.81.
This is precisely the kind of fear-premium unwind that tends to be sharp and emotional — but it doesn’t automatically mean the broader uptrend is over. That’s where Elliott Wave structure becomes useful.
ProSignalTrades Research
Want the Full Institutional Breakdown
on These Names?
Get all 5 of our institutional-grade equity research reports — full 3-statement
analysis, valuation, charts and a BUY/SELL rating with price target — in one bundle.
SPCX
CRWV
KEEL
MU
Value: €145+
€39
BUNDLE20at checkout.
Elliott Wave Outlook — Is This Wave 2 Before a Powerful Wave 3?
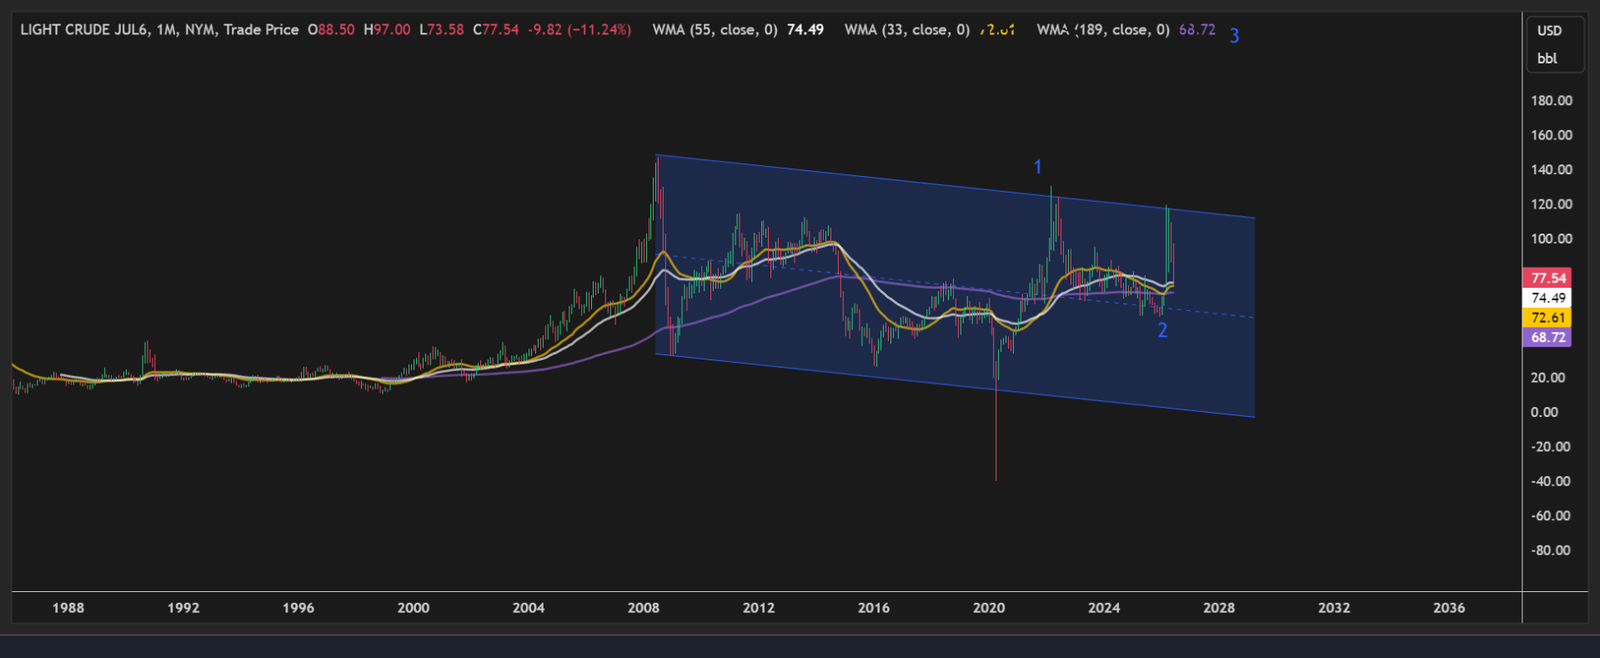
In Elliott Wave theory, a new bullish cycle typically unfolds in five waves: an initial impulsive Wave 1, a corrective Wave 2 that retraces part of that move, and then Wave 3 — usually the longest, fastest, and most powerful wave of the entire sequence, often extending well beyond the length of Wave 1.
Zooming out on the 3-month chart, WTI built a multi-year base after the extreme volatility of the past cycle and has only recently broken back above its long-term descending trendline — a structural shift that’s hard to ignore. The longer-term RSI on that timeframe sits at a healthy 58, comfortably above the neutral 50 line, which tells us the bigger picture is constructive rather than broken.
Reading the recent $55 to $119.69 advance as Wave 1 of this new structure, the current decline lines up well as Wave 2 — a corrective phase that is allowed (and even expected) to retrace deep into the 50%-61.8% zone before the trend resumes. The daily RSI has dropped to 44, deep diving to oversold territory, which is typical of a Wave 2 flush rather than the start of a fresh downtrend.
If this count is correct, a further pullback toward the $60-65 area is entirely possible before buyers step back in for Wave 3 — the move that, by Elliott Wave convention, often delivers the largest and most tradeable leg of the entire cycle, with potential to push well above the $110.24 high over the following months.
Key Fibonacci Levels on the Daily Chart
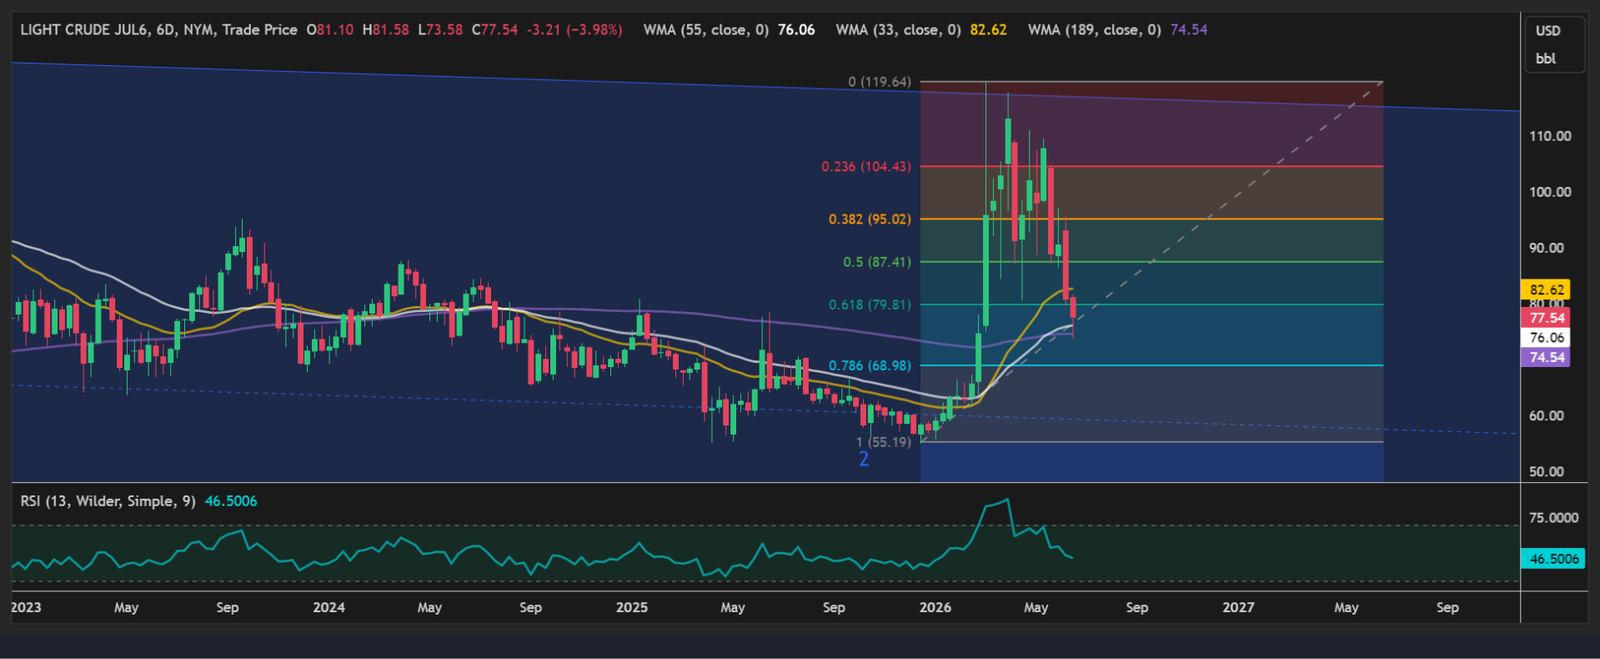
The Fibonacci grid drawn from the $55 swing low to the $119.69 swing high gives us a clean map of where buyers and sellers are likely to engage:
$104.43 — 23.6% retracement (already broken, now resistance)
$95.02 — 38.2% retracement (already broken, now resistance — also near the falling 87 moving average)
$87.41 — 50% retracement (current battleground, price is testing this level right now)
$79.81 — 61.8% retracement (the classic “deep Wave 2” level)
$65-69 zone (just below the 61.8% Fib — our preferred area for a Wave 2 low if the pullback extends)
$55 — 100% retracement (the origin of the move — a break below here would invalidate the bullish wave count entirely)
Bullish vs Bearish Triggers
Here’s what matters now:
✅ A daily close back above $84.98 → Wave 2 likely complete, Wave 3 acceleration underway, opening the path back toward $110 and beyond.
🟡 Price holding the $69.36-$77.17 zone → still consistent with a Wave 2 correction, watch for a base to form.
❌ A break below $69.36 → opens the door to the $60-65 area, our preferred zone for a Wave 2 low before the bigger move higher.
🛑 Invalidation: a sustained close below $55 would break the bullish wave count completely.
Want real-time WTI levels, Elliott Wave counts, and precise trade setups delivered straight to your dashboard? Access ProSignalTrades Premium → Use code FIFA30 for 30% off Lifetime plus a shot at a funded account, while our World Cup promotion runs till 24.06.2026.
Macro Catalysts to Watch
The technical picture doesn’t trade in a vacuum. A few fundamental threads will likely decide whether $60-65 or $84.98 gets tested first:
Strait of Hormuz flows — continued tanker movement and Kuwait’s planned output increase would keep pressure on price toward our downside zone.
US-Iran negotiations — talks have already been postponed once; any further breakdown could quickly reignite the risk premium and shorten the corrective phase.
OPEC+ supply decisions — OPEC has already trimmed its 2026 demand growth forecast, and further output adjustments from the group will shape the medium-term supply picture.
US macro data — PMI prints, GDP estimates and inflation expectations later this month could move the dollar and, with it, crude.
For live WTI pricing, you can track the contract directly on Investing.com, and for official US supply and demand data, the EIA Petroleum data hub is the most reliable primary source.
WTI Outlook — Cautiously Bullish, Watch $69 and $60-65
Our base case is that this is a Wave 2 correction inside a larger bullish structure, not the start of a new bear trend. The daily oversold RSI, the still-healthy long-term RSI above 50, and the textbook depth of this pullback all support that read.
That said, Wave 2 corrections can be deep and uncomfortable by design — a slide toward $60-65 would not break the bullish case, it would arguably complete it. The trade is simple: respect the $69.36-$60-65 zone as the area where Wave 3 buyers are likely to show up, and treat a daily close back above $84.98 as confirmation that the next leg higher has already begun.
Want real-time WTI levels, Elliott Wave counts, and trade setups delivered directly to your dashboard? Access ProSignalTrades Premium →
—
Disclaimer: This analysis is for educational purposes only and does not constitute financial advice. Trading commodities and futures involves significant risk of loss. Always conduct your own research before making any trading decisions.