Tesla (TSLA) and Space Exploration Technologies (SPCX) are both showing weakness heading into the final week of July 2026, but the technical pictures are structurally different. TSLA is drifting toward a critical weekly support level with momentum fading, while SPCX is compressing inside a textbook falling wedge that’s approaching its apex — a setup that often precedes a sharp directional move.
This analysis breaks down the exact levels on both charts and what a continuation lower would look like for each.
For more large-cap technical setups, also read our NVDA and ORCL Analysis and our QQQ vs SMH Bearish Comparison.
TSLA Stock Analysis — Slightly Bearish, Testing Support
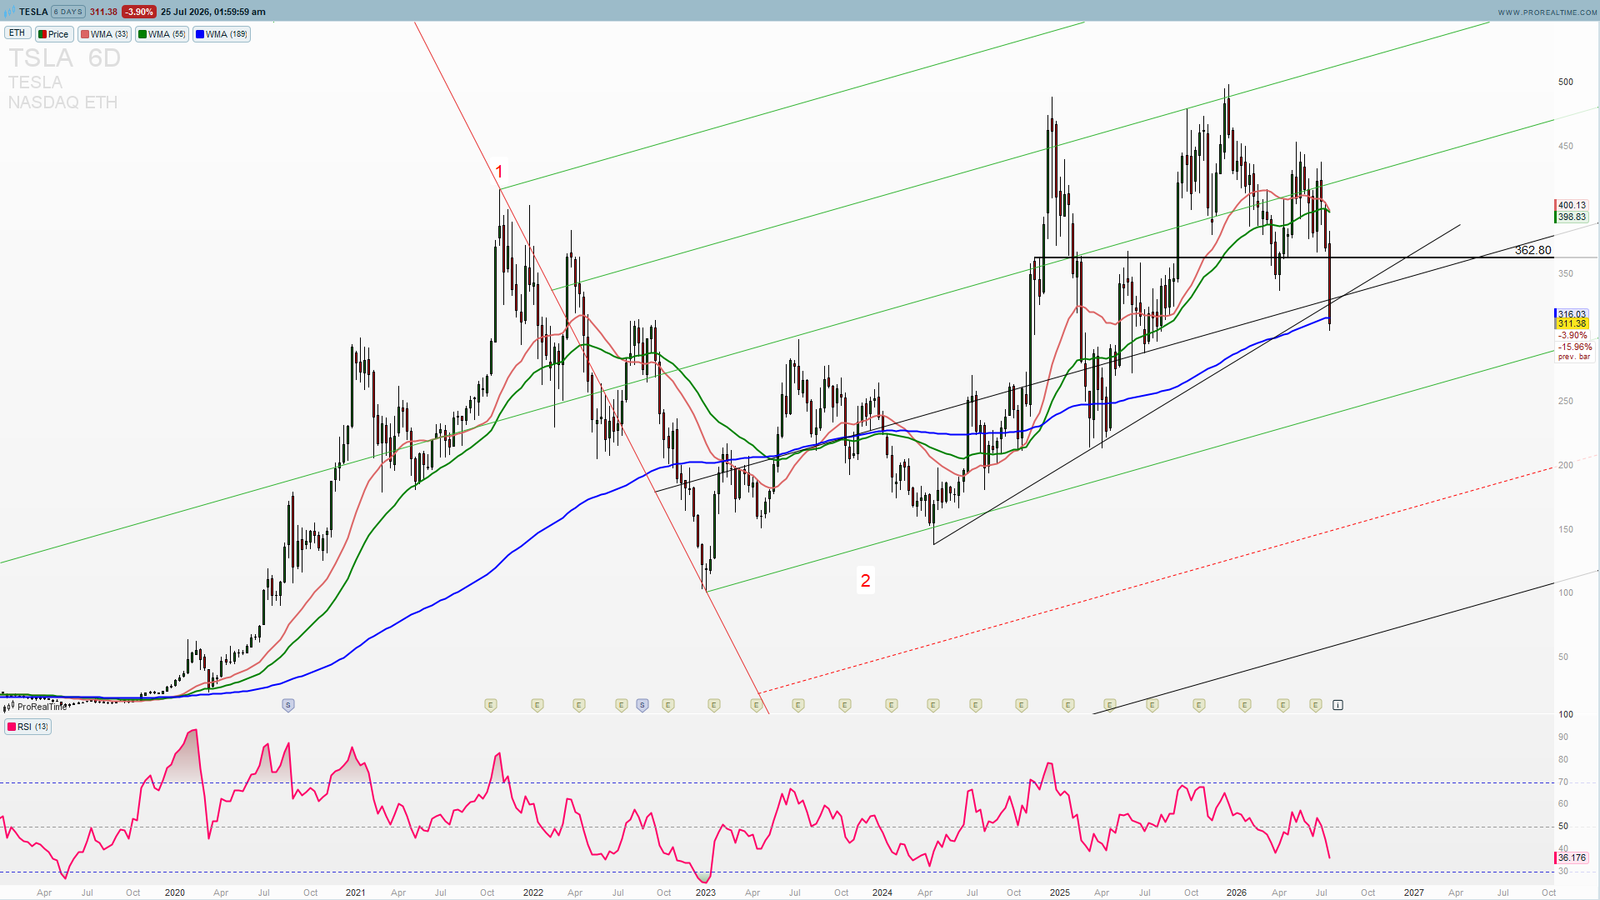
Tesla closed at $311.38, down 3.90% on the week, and is now trading just above its 52-week low of $306.51 — a level that has held on multiple prior tests but is being pressured again.
Momentum Has Faded
TSLA is trading below both its 20-week moving average ($392.93) and 50-week moving average ($330.81) — a bearish alignment that confirms the stock has lost its short and medium-term uptrend structure. The weekly RSI at 35.19 sits well below the neutral 50 line, reflecting sustained selling pressure rather than a temporary pullback within a stronger trend.
Broken Rising Structure
The chart shows TSLA emerging from a multi-year base, rallying into a rising channel through 2025 that carried the stock from the low-$100s toward highs near $490. That rally has since reversed, and price is now testing the lower boundary of the more recent ascending structure. A decisive break of this rising trendline support — combined with RSI remaining under 40 — would confirm the bearish continuation scenario rather than a healthy pullback within an intact uptrend.
The $362.8 Level Is Now Resistance
The horizontal level at $362.83 — previously an area of consolidation — has flipped from support to resistance following the breakdown. Any recovery attempt that stalls below this zone keeps the near-term structure bearish.
TSLA Key Levels
🔴 BEARISH BELOW $306.51
A weekly close below the year low confirms trend continuation lower:
$306.51 — 52-week low, immediate support / breakdown trigger
$330.81 — SMA 50, first resistance on any bounce
$362.83 — Prior consolidation zone, now key resistance
⚠️ NEUTRAL WHILE HOLDING $306–$330
Price chopping in this zone suggests indecision rather than a clean directional move. A weekly close back above $392.93 (SMA 20) would be needed to meaningfully repair the chart.
SPCX Stock Analysis — Falling Wedge Approaching Apex
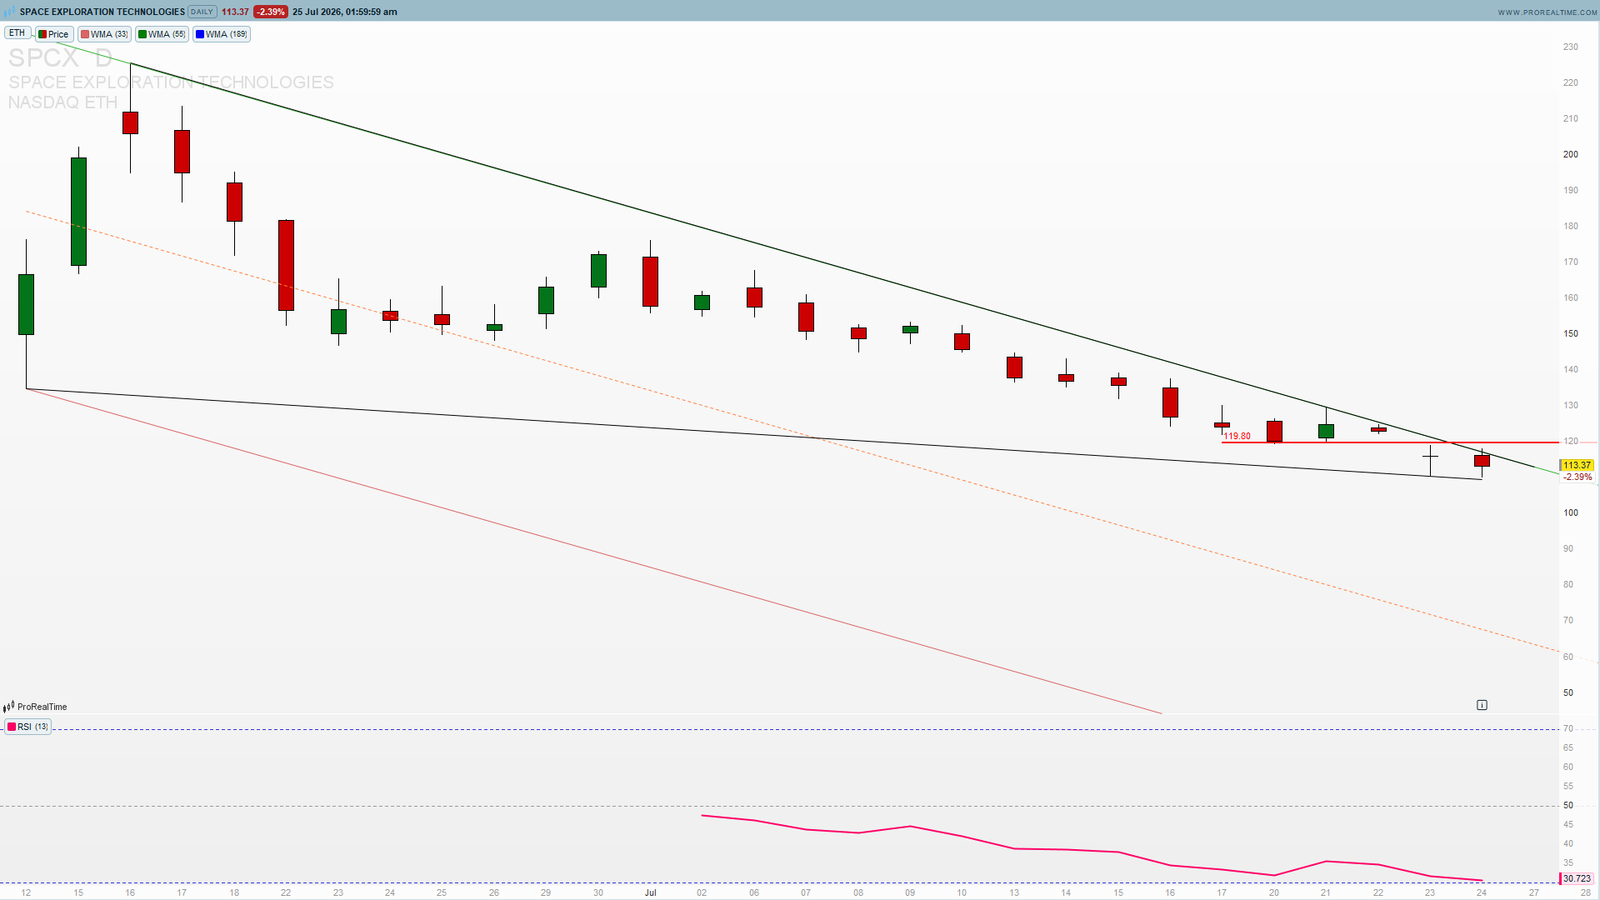
Space Exploration Technologies (SPCX) is showing a much clearer and more advanced bearish pattern: a falling wedge / descending triangle that has been compressing since the 52-week high of $225.64.
The Falling Wedge Structure
The daily chart shows a well-defined pattern — a steep descending trendline connecting the lower highs since the peak, converging with a shallower descending support line connecting the sequence of lows. Price is now trading at $113.37, down 2.39% on the day, right at the lower boundary of this structure and near the apex where the pattern typically resolves with a decisive move.
Oversold But Not Yet Reversing
The RSI at 31.81 is in oversold territory, which sometimes precedes a bounce. However, oversold conditions within a strong downtrend can persist for extended periods — RSI alone is not a reversal signal without price confirmation. The wedge’s lower trendline is the level that actually matters here.
Limited Historical Data — Using Structural Targets
SPCX doesn’t yet have enough trading history to establish long-term structural support from prior price action, so downside targets here are derived from the wedge’s measured move and the pattern’s geometry rather than historical demand zones. A confirmed breakdown from the current wedge structure — a daily close below the $110–113 support zone — opens a path toward the $80–90 region as the next area where the descending structure would be expected to find a floor.
SPCX Key Levels
🔴 BEARISH BELOW $110
A daily close below the wedge’s lower boundary confirms the breakdown:
$110–113 — Current wedge support / breakdown trigger
$80–90 — Structural target zone if the breakdown confirms (measured-move based, limited historical data available)
🟢 BULLISH ABOVE $150
A recovery back above the wedge’s upper resistance area would suggest the compression is resolving higher instead:
$150–160 — First resistance zone on a reversal
$225.64 — 52-week high, only relevant on a much larger recovery
What to Watch This Week
TSLA — Year Low Retest
The $306.51 level is the line for Tesla. Holding it keeps the door open for a relief bounce toward $330. Losing it on a weekly close confirms the bearish continuation scenario the current RSI and moving average alignment already suggest.
SPCX — Wedge Resolution
Falling wedges resolve — the only question is direction and timing. With price now near the apex, a break is likely imminent. A clean break below $110 targets the $80–90 zone; a break back above the wedge’s upper trendline would invalidate the bearish case entirely.
TSLA and SPCX — Summary
TSLA at $311.38:
🔴 Bearish below $306.51 — trend continuation lower likely if lost
⚠️ Neutral chop between $306–$330 until resolved
SPCX at $113.37:
🔴 Bearish below $110 — falling wedge targets $80–90
🟢 Invalidated above $150
Both names are showing weakening momentum into the end of July, but SPCX’s pattern is more structurally advanced and closer to a resolution point. TSLA’s setup is more about whether a well-established support level holds one more time or finally gives way after months of weakening momentum underneath it.
TSLA Live Price — Investing.com
Want the full institutional-grade research behind these names? Our research bundle covers TSLA and 10 other high-conviction tickers with ratings, price targets, and full bull/bear case breakdowns.
—
Disclaimer: This analysis is for educational purposes only and does not constitute financial advice. Trading involves significant risk. Always conduct your own research before making any investment decisions.