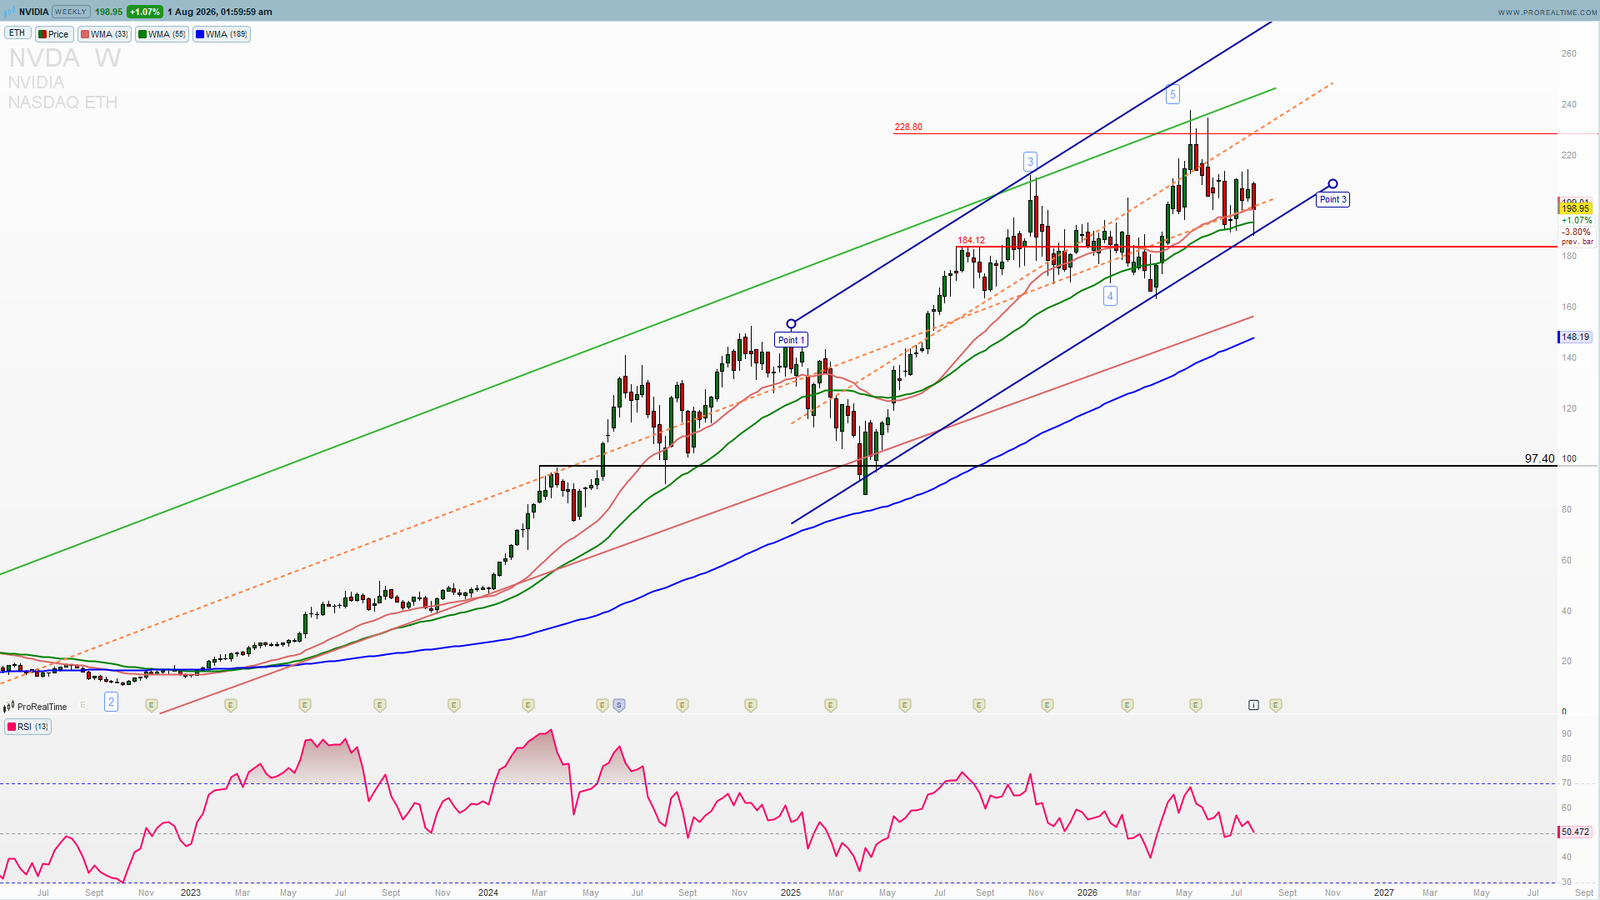
NVIDIA (NVDA) closed the week at $198.95, up 1.07%, and the weekly chart is doing something worth paying attention to: consolidating directly on top of a stack of support rather than breaking down through it. The NVDA support levels in August 2026 are unusually layered — three distinct floors sit within 18% of current price, and the stock is holding above all of them.
This is not a breakout setup. It is a base-holding setup, and the distinction matters for how you position around it.
For related semiconductor setups, also read our SMH Support Test at $488 and our QQQ vs SMH Bearish Comparison.
NVDA Stock Analysis — Neutral Momentum, Bullish Structure
NVDA is trading 16.3% below its 52-week high of $237.68 and 21.8% above its 52-week low of $163.31. That places price roughly in the upper-middle of its yearly range — neither extended nor distressed.
The Moving Average Stack Is Intact
Price sits above all three weekly moving averages in correct bullish sequence: WMA 33 at $193.66, WMA 55 at $167.76, and WMA 189 at $141.94. Price is only 2.7% above the WMA 33, which means the stock has already done most of its mean reversion work. The gap between price and its intermediate average is narrow, not stretched.
RSI at 50.91 Is the Definition of Neutral
The weekly RSI sits almost exactly on the 50 line. There is no momentum divergence, no overbought condition to unwind, and no oversold capitulation. This is a market with no directional urgency — which is precisely why the support levels matter more than momentum here.
The Rising Channel Has Not Broken
The chart shows NVDA advancing inside a well-defined rising channel structure since 2025, with the lower boundary now converging near current price. That ascending trendline has held on every test since the April 2025 low near $97.40. Price is sitting on it again rather than beneath it.
NVDA Support Levels — Three Layers Deep
The reason this setup reads neutral-to-bullish rather than neutral is confluence. Multiple independent support types are clustered in a narrow band beneath price.
Layer 1: WMA 33 at $193.66
The first line of defense, only 2.7% below price. This average has tracked the advance from the 2025 base and has acted as dynamic support on prior consolidations.
Layer 2: Horizontal Support at $184.12
This level marked the breakout zone earlier in the advance and has since flipped from resistance to support — the classic polarity change. It sits 7.5% below current price and has been tested repeatedly without failing.
Layer 3: WMA 55 at $167.76 and the 52-Week Low at $163.31
These two levels sit within 3% of each other, forming a combined structural floor roughly 16-18% lower. A move to that zone would be a significant correction, but the structure of the uptrend would still technically survive it.
Go Deeper on NVDA
This analysis covers the chart. The institutional research report covers everything underneath it — data center revenue trajectory, margin structure, earnings call breakdown, analyst consensus, and a derived 12-month price target with full bull vs. bear case comparison.
NVDA is included in two bundles:
🔹 AI Infrastructure Bundle — €39
NVDA + SPCX + CRWV + KEEL + MU. The complete AI stack: data center compute, GPU cloud, memory/HBM, and private-market space exposure.
View Bundle →
🔥 11-Report Complete Catalog — €79 (normally €270+ — save 70%)
OPEN · CRWD · SPCX · NVDA · KEEL · PLTR · MU · CRWV · SKHY · TSLA · AMD — every current report in one download.
Get the Bundle →
Every report includes an executive summary and investment rating, income statement and profitability analysis, balance sheet review, operating KPI deep-dive, latest earnings call highlights, valuation and analyst consensus, and a 12-month price target derivation.
Browse all research bundles and individual reports →
NVDA Key Levels
🟢 BULLISH ABOVE $210
A weekly close above the recent consolidation ceiling opens the path back toward the highs:
$210 — Consolidation ceiling / confirmation trigger
$228.80 — Horizontal resistance, +15.0% from current price
$237.68 — 52-week high, upper channel boundary
⚠️ NEUTRAL BETWEEN $184 AND $210
This is where price currently sits. Chop inside this range is consolidation, not signal. RSI at 50.91 confirms neither side has control. Sideways action here allows the WMA 33 to catch up and tighten the structure — a constructive outcome even though it looks like nothing on the chart.
🔴 BEARISH BELOW $184.12
A weekly close beneath the horizontal support would invalidate the base:
$184.12 — Prior breakout level, structural breakdown trigger
$167.76 — WMA 55, next major support
$163.31 — 52-week low, final structural floor
Why This Setup Reads Neutral to Bullish
Support Density Favors the Upside
The distance from price to the first meaningful breakdown level is 7.5%. The distance to the first meaningful upside target is 15.0%. That asymmetry alone does not make a trade, but combined with an intact moving average stack and an unbroken rising channel, the structure is skewed constructively.
The Sector Context Is Mixed
Semiconductors have led the market in 2026, and NVDA is the anchor of that leadership. However, the broader semiconductor complex is currently pulling back toward its own weekly averages. NVDA holding this base while the sector corrects would be a relative strength signal. NVDA breaking down with it would confirm a sector-wide rotation rather than a stock-specific issue.
NVDA Live Price — Investing.com
What to Watch This Week
NVDA — The $193.66 Reaction
The WMA 33 is the immediate tell. Price holding above it keeps the base intact and the neutral-to-bullish read valid. A weekly close below it shifts attention to $184.12, which is where the real structural argument happens.
Confirmation Requires $210
Nothing in this chart confirms a new leg higher until price closes a week above $210. Until then this is a stock defending a base, not launching from one — and those are different risk profiles.
—
NVDA — Summary
NVDA at $198.95:
🟢 Bullish above $210 — targets $228.80, then the $237.68 high
⚠️ Neutral between $184–$210 — consolidation, no directional signal
🔴 Bearish below $184.12 — opens $167.76 and the $163.31 year low
NVIDIA is not breaking out and it is not breaking down. It is sitting on three layers of support with neutral momentum and an intact channel structure — a setup that rewards patience over prediction. The stock has already absorbed a 16% drawdown from its high without damaging the trend, and the levels beneath it are close enough together to define risk precisely.
Track NVDA and every US-listed ticker in real time — live charts, news, Elliott Wave bias and SEC-sourced fundamentals on one screen with PST Terminal. 7-day trial for €3.99.
—
Disclaimer: This analysis is for educational purposes only and does not constitute financial advice. Trading involves significant risk. Always conduct your own research before making any investment decisions.