


For related setups, also read our Gold Bearish Setup and our XAGUSD Bullish Reversal.
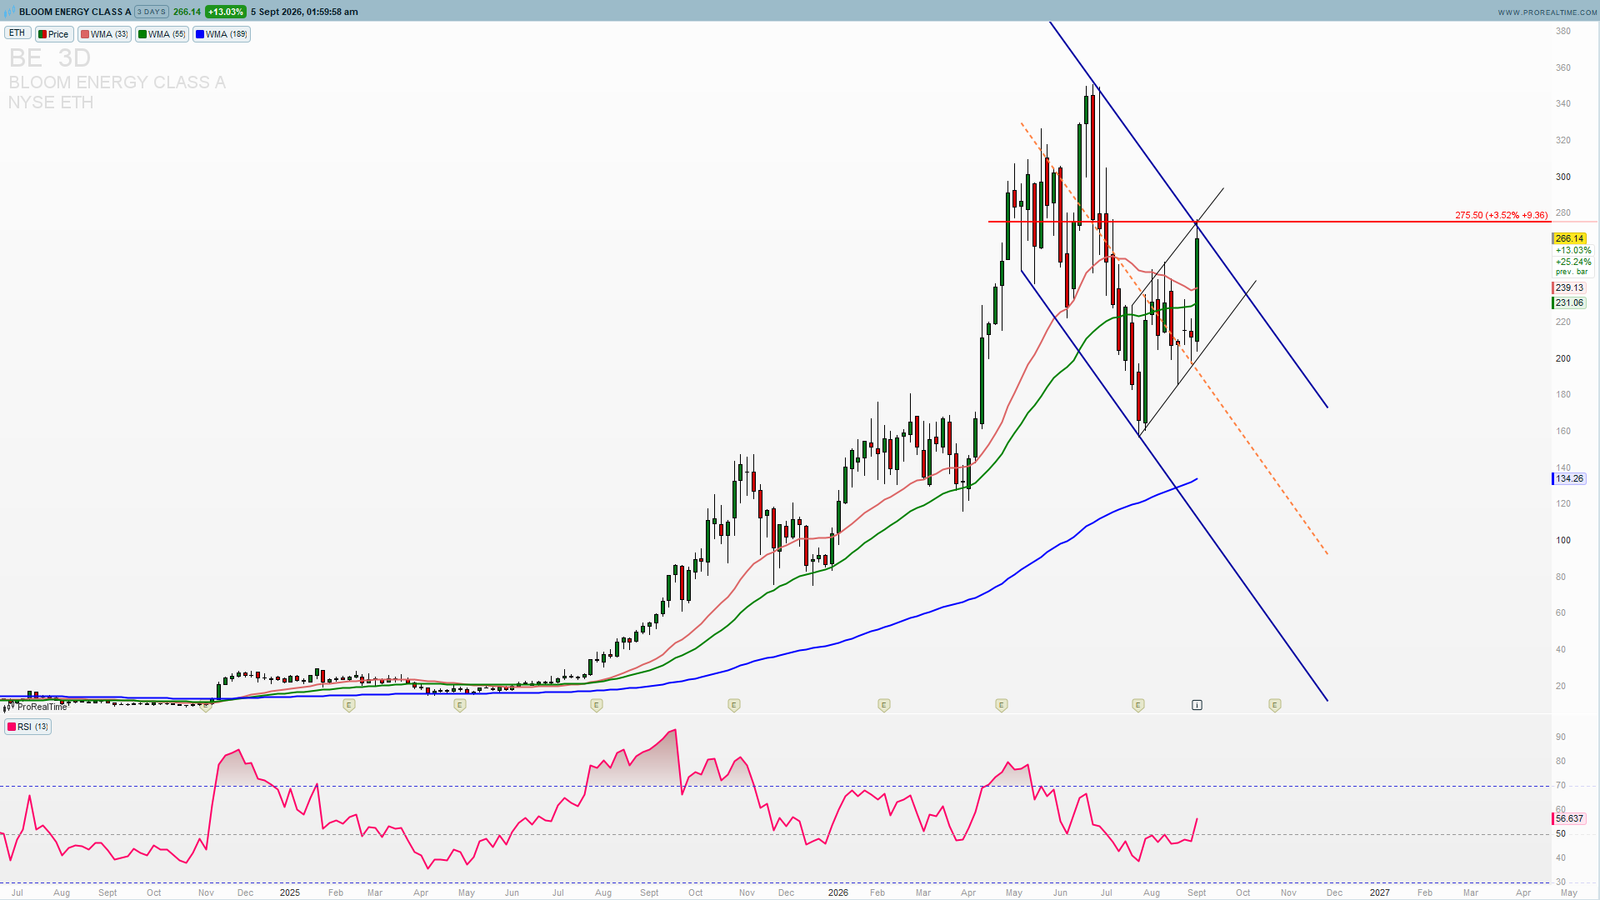
The Bloom Energy bearish setup is now the dominant structure on the BE chart. Shares surged 13.03% to close at $266.14, but that entire move is running straight into a level that has already turned price away once — $275.50, reinforced by a descending trendline drawn from the $340 high. The level that matters from here is that resistance zone, and the reaction at it determines whether this remains a corrective bounce or confirms a real trend change.
This is not a case of chasing strength. It is a sharp rally arriving directly at layered resistance, and the setup favors a fade back into the range unless bulls can actually clear it.
Bloom Energy Bearish Setup — Rejection at the Descending Trendline
The 3-day chart shows BE climbing off the $155 base inside a descending parallel channel that has capped every recovery attempt since the June–August blow-off top near $340. Friday’s 13% candle is the sharpest bar of that entire recovery, and it has pushed price back above the WMA(33) at $239.13 and the WMA(55) at $231.06 while breaking the shorter trendline that had been rejecting every bounce since the top.
The Rally Is Arriving at Layered Resistance
$275.50 already rejected price once near the recent highs, and the descending trendline from $340 passes through almost exactly the same zone. A single high-momentum candle running straight into two confirmations of the same resistance, rather than grinding through it over several sessions, is a classic setup for exhaustion — not the start of a breakout.
RSI at 56.6 Shows Momentum, Not Confirmation
The RSI(13) sits at 56.637 — comfortably out of oversold and with real momentum behind Friday’s move, but nowhere near the overbought readings that typically accompany a genuine breakout through major resistance. There’s room for one more push, but nothing here yet confirms buyers can actually clear the zone rather than simply testing it.
The Long-Term Trend Is Still Intact
BE remains well above its long-term WMA(189) at $134.26, underscoring that the primary uptrend from the 2024 lows hasn’t been broken by this correction. That matters for context, but it doesn’t change the near-term math: this is a pullback inside a bull trend testing resistance, not a confirmed continuation yet.
BE Key Levels — What a Break Above $275.50 Would Open
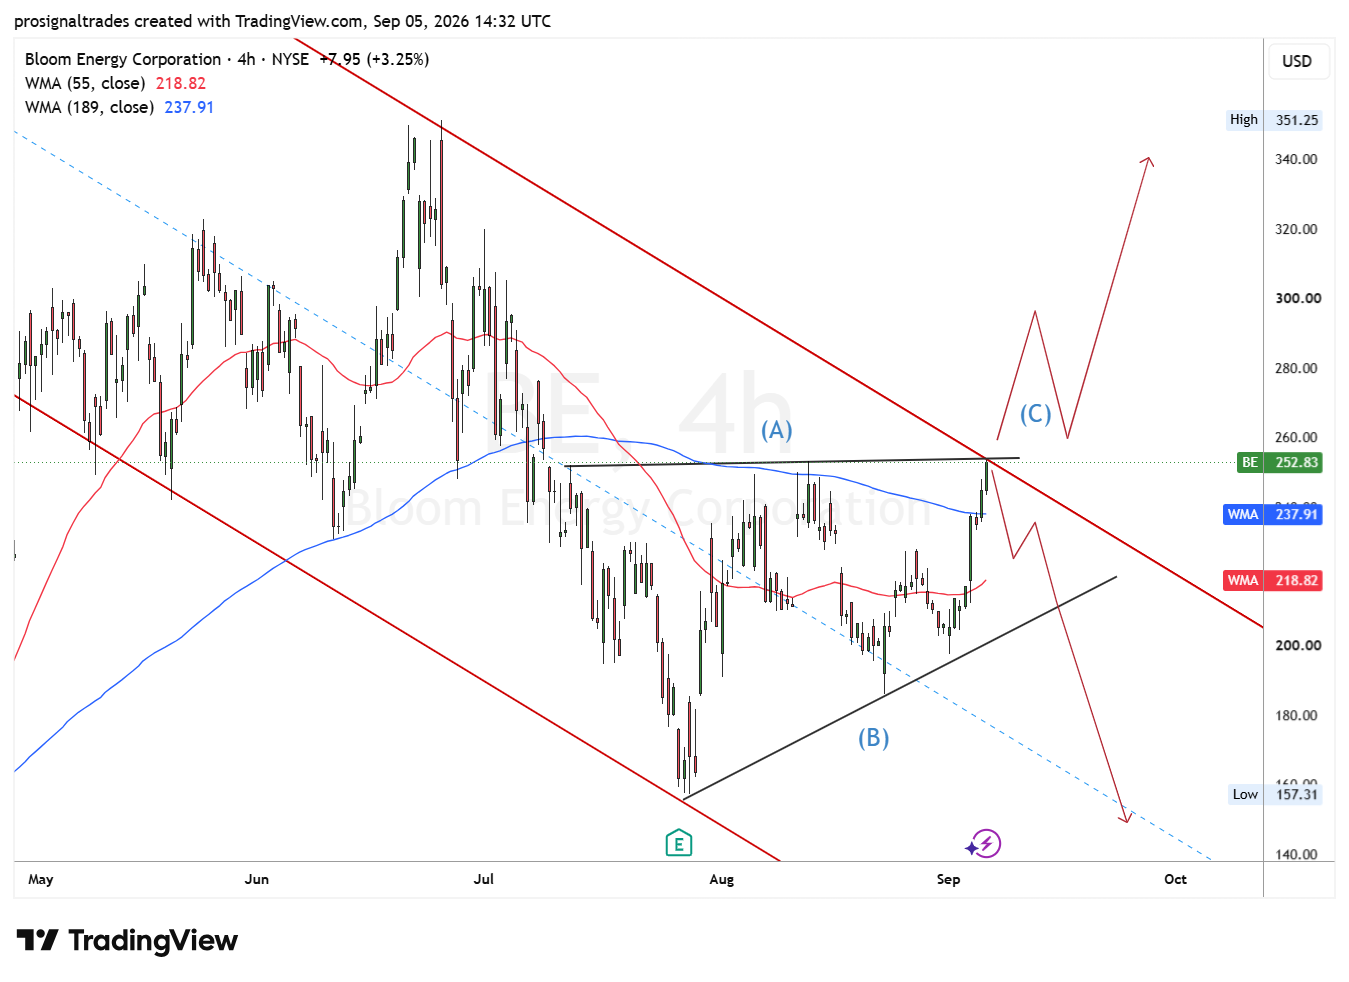
The confluence here is straightforward: horizontal resistance rejected once already, a descending trendline overhead, and momentum that hasn’t yet proven it can break through.
Critical Resistance: $275.50
This is the entire thesis. A decisive daily close above this level and the descending trendline, ideally with continued volume, is the only thing that shifts this from a bearish fade setup to a confirmed breakout.
Next Target Above: $300
The psychological round-number level, followed by the prior swing high near $340 if $275.50 clears with follow-through.
Support on Rejection: $239.13 → $231.06
The WMA(33) and WMA(55) — a close back below both would confirm the rejection scenario and put the reversal case back in question.
Structural Support: $215 – $220
The lower boundary of the descending channel, the level that has held on every prior test since the correction began.
Why This Setup Reads Bearish
The Rally Ran Into Resistance It Hasn’t Earned Yet
Sharp recovery candles inside a descending channel are common. What separates a genuine reversal from a bounce that gets sold is whether price actually clears the trendline and the horizontal level with follow-through, rather than tagging both in the same session it arrived. This one has done neither yet.
Sector Context
Bloom’s bull case is built almost entirely on data center power demand, but the cost side of that story is getting more expensive: natural gas power costs have hit a 17-year high on data center demand, according to Lazard data reported by Oil & Gas 360. Rising input costs across the power generation space are a headwind investors will be watching alongside the technical picture. Traders can follow live BE price action and analyst ratings on MarketBeat for real-time confirmation.
What to Watch This Week
The $275.50 Reaction
Everything hinges on this zone. Price stalling and rolling back below the WMA(33)/WMA(55) cluster keeps the fade thesis intact. A decisive close above it opens the path toward $300 quickly.
Confirmation Requires Follow-Through
A single close above $275.50 is a signal; two consecutive closes above it with expanding volume is confirmation. Until that happens, this remains a rejection setup at resistance rather than a completed breakout.
BE Summary
Bloom Energy at $266.14:
🔴 Bearish below $275.50 — favors a fade toward $239.13, then $231.06
⚠️ Neutral if price grinds sideways between $231 and $275 — range-bound, no directional edge
🟢 Invalidated on a confirmed close above $275.50 and the descending trendline — that would reopen $300 and eventually the $340 highs
Bloom Energy’s rally is real, but it arrived exactly where the descending trendline and horizontal resistance said it would be tested, with RSI still short of overbought and the moving averages only just reclaimed. The structure now rests on a single level. Below $275.50 this is a level to fade; above it, with confirmation, the path back toward $300 and $340 opens up.
Track BE and every major stock, index, and metal in real time — live charts, moving average structure, and market bias on one screen with PST Terminal, included with the PST All-Access plan 8.99 EUR trial and new BLOOM energy institutional grade stock research report ready
—
Disclaimer: This analysis is for educational purposes only and does not constitute financial advice. Trading involves significant risk. Always conduct your own research before making any investment decisions.
1 comment