Silver (XAGUSD) closed at $63.57, up 3.10% on the day, and the move is doing something the last two months of chop hasn’t: pushing price back above its short-term moving averages and directly into a resistance shelf that has capped every rally since June. The XAGUSD bullish reversal setup in August 2026 hinges on a single level — a close above $67.40 opens the door to the 68-70 zone, and beyond that, a run at $80.
This is not a confirmed breakout yet. It is a reversal attempt testing its first real resistance, and the distinction matters for how you size and time around it.
For related metals and commodity setups, also read our Gold (XAUUSD) Price Analysis and our Bitcoin Price Analysis.
XAGUSD Technical Analysis — Momentum Building, Resistance Overhead
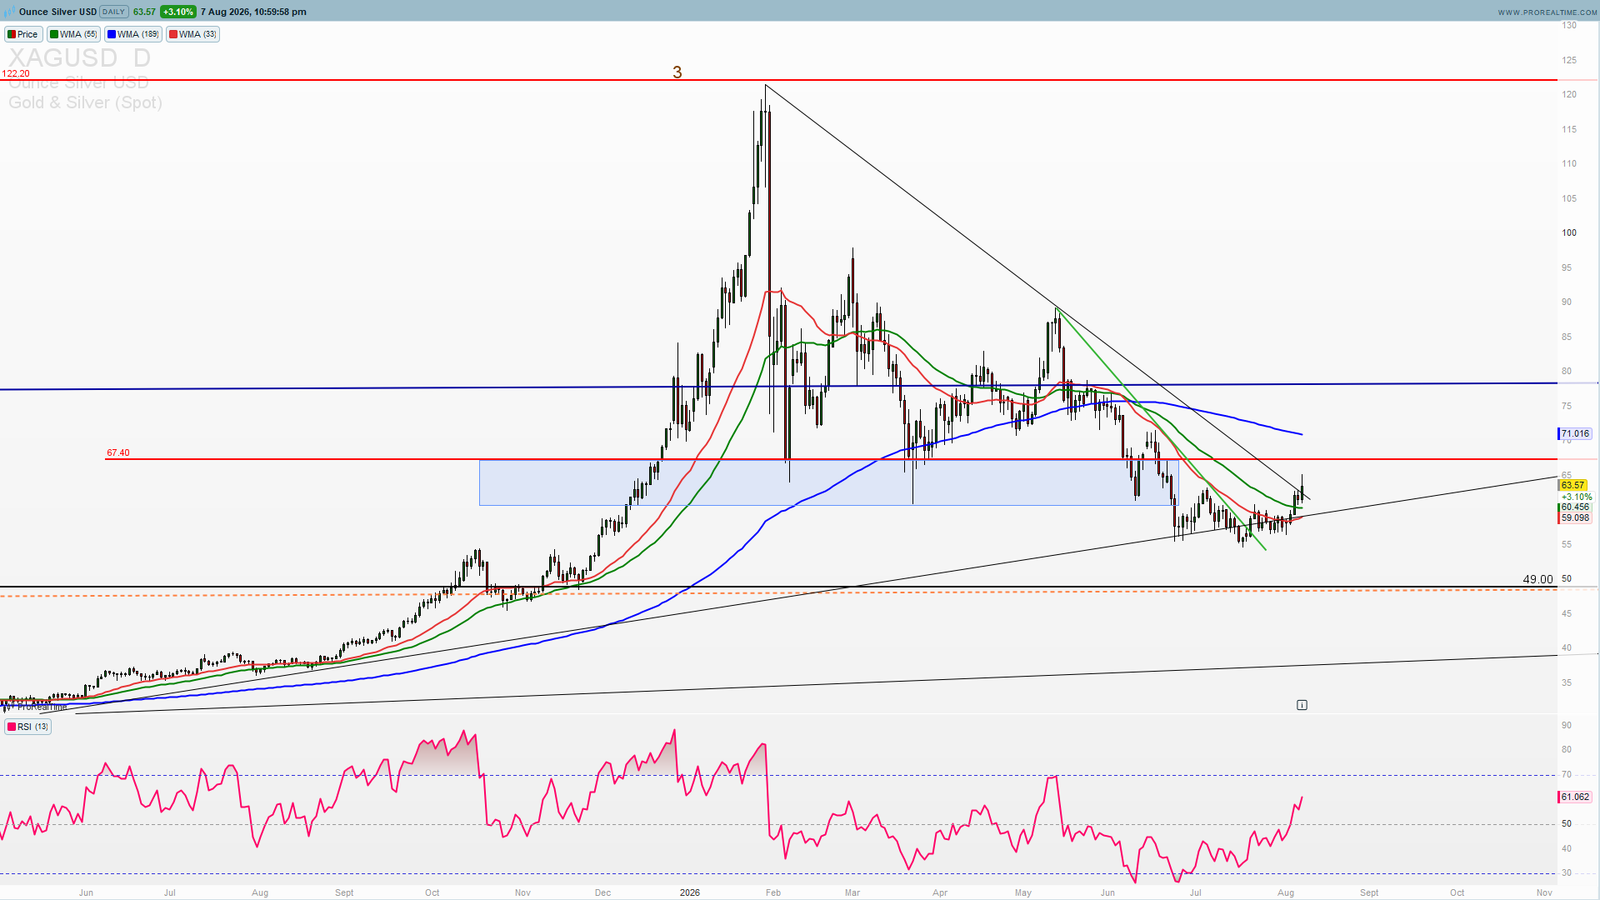
Silver remains 48% below its 2026 high near $122.20 and has spent the last two months carving out a base well beneath the descending trendline that’s defined the entire correction from that top. Today’s move is the most decisive test of that trendline since the reversal began.
The Moving Average Stack Is Flipping
Price has just reclaimed WMA 33 ($59.10) and WMA 55 ($60.46), both of which had been resistance for weeks. WMA 189 ($71.02) is still overhead — that’s the one line left standing between here and a fully bullish stack. Price closing back above its two faster averages while still below the long-term average is exactly the setup that precedes a stack flip if momentum holds.
RSI at 61 — Room Left Before Overbought
The daily RSI(13) sits at 61.06, elevated but with real room before the 70 overbought line that capped every prior rally attempt in this chart (Oct, Jan, Mar, May). This is acceleration without exhaustion — the kind of RSI reading that supports a continuation move rather than warns against one.
Converging Trendlines — The Wedge Is Resolving
The chart shows a textbook descending-versus-ascending trendline squeeze: the downtrend line from the $122.20 high has been compressing against a rising support trendline built from the lows since last year. Price is coiling directly at the point where those two lines converge. A break of the descending line here is structurally significant — it’s not just a level, it’s the resolution of a multi-month wedge.
XAGUSD Key Levels — What a Break Above $67.40 Opens
The reason this reads as a genuine reversal setup rather than a dead-cat bounce is confluence — the resistance shelf, the descending trendline, and the WMA 189 all cluster in the same narrow band just overhead.
Zone 1: Resistance Shelf at $67.40
This horizontal level has rejected every rally since the correction began and sits almost exactly on the descending trendline from the highs. It’s the first real obstacle and the line that decides whether today’s move is a genuine reversal or another failed test.
Zone 2: The 68-70 Test
Clearing $67.40 puts price directly into the 68-70 band, where WMA 189 ($71.02) sits. This is the first real test of the long-term trend average — the line that’s been resistance on every attempt since March. A hold above this zone would mark the first time in months silver has traded above all three moving averages simultaneously.
Zone 3: The $80 Target
Beyond the 68-70 test, the measured move points toward $80 — the upper boundary of the broader consolidation range that held for most of Q1-Q2 2026 and the next structural shelf before price re-enters the upper third of the year’s range. This is the level where a genuine trend reversal gets confirmed rather than just attempted.
XAGUSD Summary
XAGUSD at $63.57:
🟢 Bullish above $67.40 — opens the 68-70 test, then a run at $80
⚠️ Neutral between $60 and $67.40 — reclaiming the short-term averages, resistance still overhead
🔴 Bearish below $59.10 — loses WMA 33/55, re-opens the descending trendline as resistance rather than a level in the process of breaking
XAGUSD Live Price — Investing.com
Silver Spot Chart — Kitco
Silver has spent two months building a base directly beneath the trendline that’s defined its entire correction from $122.20. Today’s move is the first serious test of that line with RSI still short of overbought and both short-term averages just reclaimed. The setup isn’t confirmed until $67.40 breaks and holds — but the structure behind it is the most constructive this chart has shown since the correction began.
Track XAGUSD and every major pair, index and metal in real time — live charts, WMA structure, news and Elliott Wave bias on one screen with PST Terminal, now included free with the PST All-Access plan.
Founding Member Offer
Everything We Built. One Plan. Forever Price.
Terminal, Elliott Wave & ICT Scanners, full research library, and live signals — one login, no tiers.
—
Disclaimer: This analysis is for educational purposes only and does not constitute financial advice. Trading involves significant risk. Always conduct your own research before making any investment decisions.