For related crypto and index setups, also read our Bitcoin Price Analysis and our Nasdaq 100 Reversal.
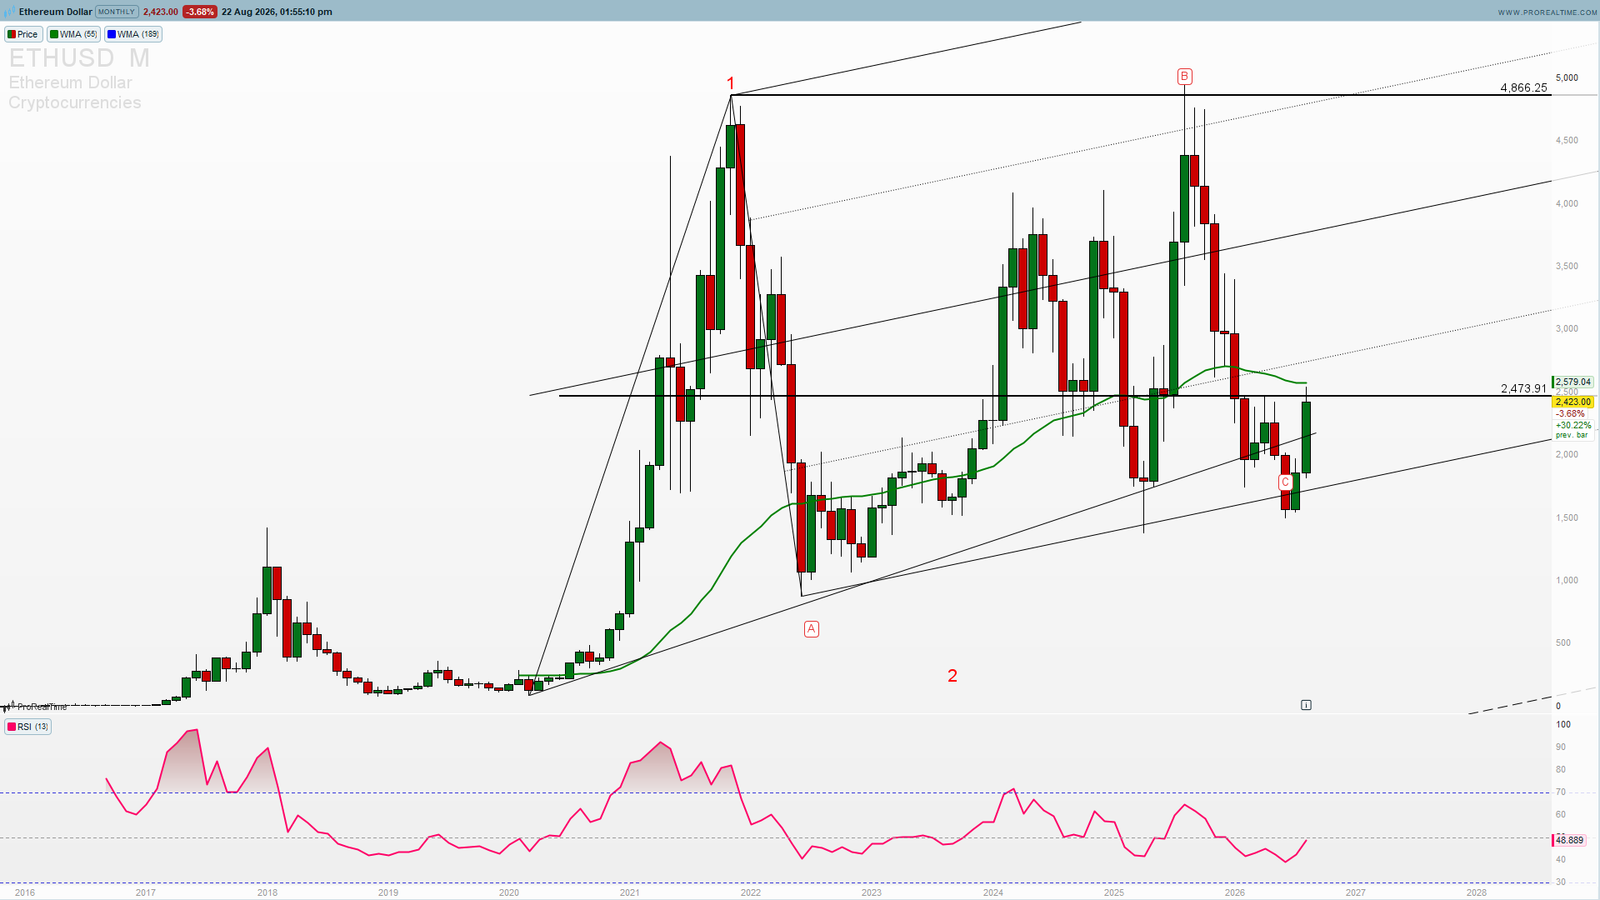
Ethereum (ETHUSD) is trading at $2,421.66, down 3.74% and sitting right at one of the most important structural levels on its entire monthly chart. The Ethereum bullish setup in August 2026 comes down to a single number: a monthly close back above $2,473.91 — the horizontal line that has acted as both support and resistance since 2022 — is what separates a healthy pullback from a trend that’s rolling over.
This is not a breakout call. It’s a level that has already proven itself twice on this chart, and price is testing it again right now.
Ethereum Technical Analysis — Testing a Level That’s Held Since 2022
The monthly chart tells a clean story. The $2,473.91 line has flipped between support and resistance multiple times across this cycle — it capped price during the 2023 recovery, held as support through parts of 2024, and now sits directly at current price after ETH pulled back from the year high of $3,402.33.
Price Is Sitting Exactly on the Rising Trendline
The long-term ascending trendline drawn from the 2022 low (around $1,000) is intersecting almost exactly where price trades today. This is the same trendline that has supported every major low since the bottom — the current candle is testing it directly, not approaching from a distance.
RSI at 48.9 — Neutral, Not Broken
The monthly RSI sits at 48.93, essentially at the midpoint. There’s no oversold capitulation and no overbought exhaustion — this is a market pausing at a decision point rather than one showing clear directional momentum in either direction. That neutrality is exactly why the structural levels matter more here than momentum indicators.
The Moving Averages Are Still Separating
The red and blue moving averages on this chart are still in a constructive sequence from the 2022 base, though the gap has narrowed considerably since the year high near $3,402. Price closing back above both would reset the short-term structure toward the bullish side.
Ethereum Key Levels — What a Close Above $2,500 Opens
The setup here is straightforward: horizontal resistance, the long-term rising trendline, and neutral RSI are all converging in the same narrow band around current price.
Bullish Trigger: $2,473.91 – $2,514.99
This is the zone that matters most. The horizontal line at $2,473.91 has been pivotal since 2022, and the $2,514.99 mark sits just above it. A confirmed close above this zone — ideally on a monthly basis — would put ETH back above the level that’s separated recovery attempts from failed ones across this entire cycle.
First Target: The 2025-2026 Consolidation Zone
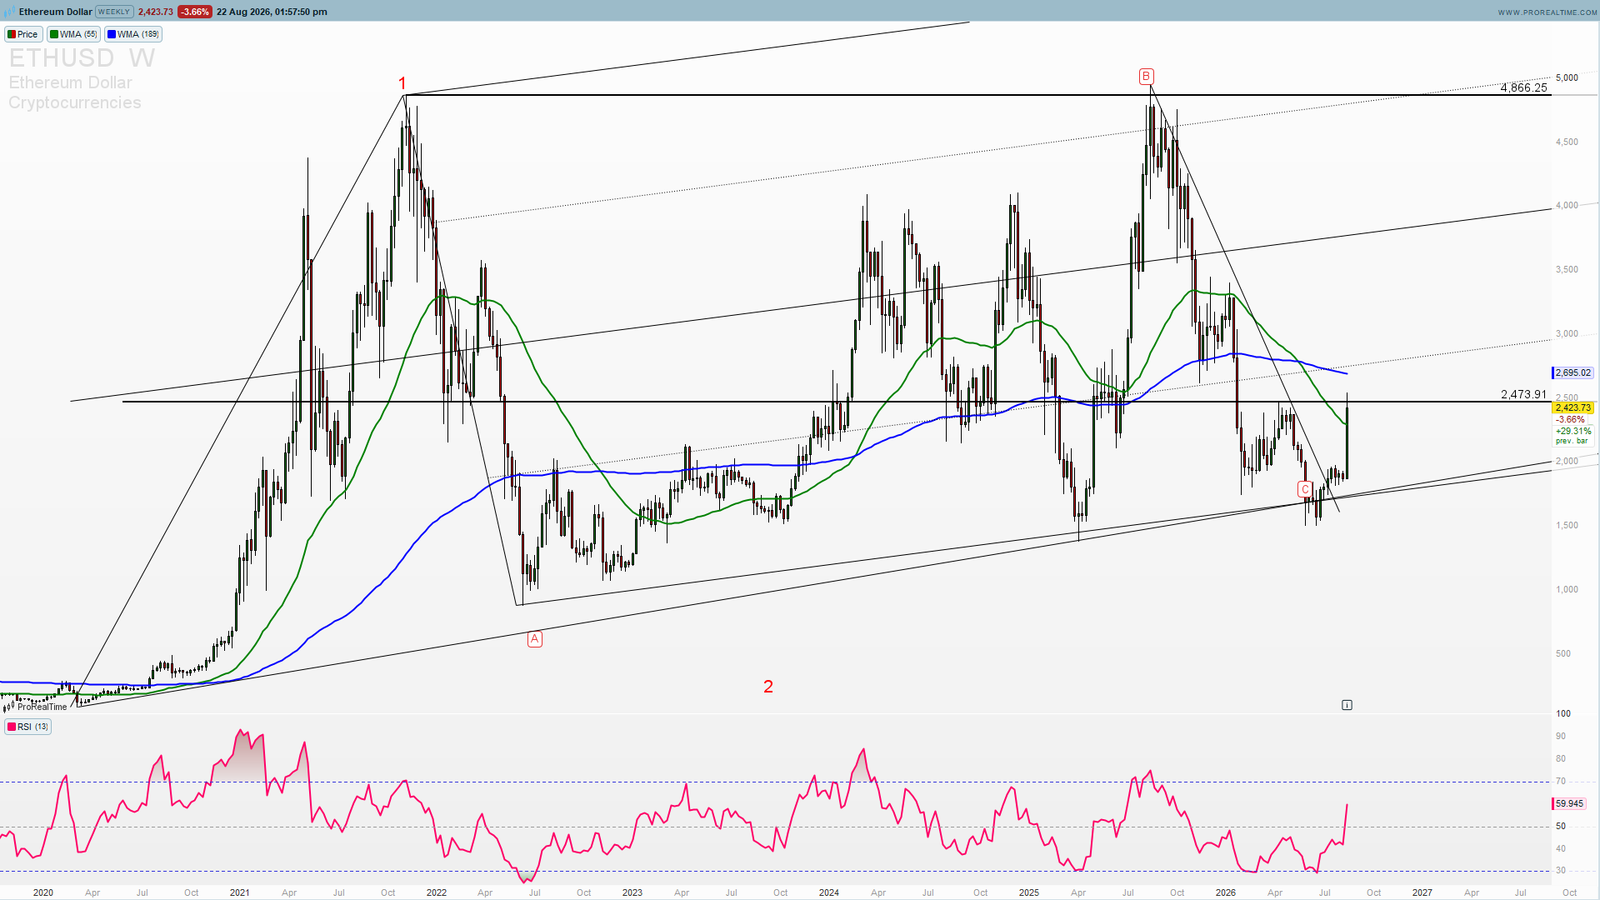
Above $2,514.99, the next area of interest is the range where price built its base before the most recent leg toward the year high — broadly the $2,700-3,000 band, where the descending red moving average currently sits.
Stretch Target: Year High Retest at $3,402.33
A sustained move back above the key resistance zone reopens the path toward the year’s high. This is a longer-term target, not an immediate one, but it defines what a genuine trend resumption would look like.
Invalidation: Rising Trendline Support
The ascending trendline from the 2022 low is the line that matters on the downside. A confirmed monthly close below it — and below the $1,927.19 marked support — would undercut the entire bullish structure built since the bottom of this cycle.
Why This Setup Reads Bullish Above $2,500
Multi-Year Level Confluence
It’s rare for a single price zone to combine a horizontal level that’s mattered since 2022 with a rising trendline from the same cycle low. When both sit at the same price, the reaction there tends to carry more weight than an isolated technical signal.
Sector Context
Ethereum’s move is happening alongside a broader crypto rally, with Bitcoin also testing key resistance in the same window. A recovery in ETH that clears $2,500 while BTC holds its own structure would reinforce the case that this is sector-wide strength rather than an isolated bounce.
What to Watch This Week
The $2,473.91 – $2,514.99 Reaction
This zone is the whole thesis. Price closing back above it on strong volume shifts the near-term bias constructively. Repeated rejection here keeps ETH range-bound at best.
Trendline Support Below
As long as the rising trendline from the 2022 low continues to hold on pullbacks, the broader structure remains intact even if the immediate reaction at resistance is choppy.
Traders can follow live Ethereum price action on Investing.com for real-time confirmation.
Ethereum Summary
ETHUSD at $2,421.66:
🟢 Bullish above $2,473.91–$2,514.99 — targets the $2,700-3,000 zone, then a longer-term retest of $3,402.33
⚠️ Neutral / consolidating between the rising trendline and resistance — RSI at 48.9 shows no clear directional edge yet
🔴 Bearish on a confirmed close below the 2022 rising trendline and the $1,927.19 support level
Ethereum is testing a level that has defined this entire market cycle — a horizontal line that’s flipped between support and resistance since 2022, intersecting almost exactly with the long-term rising trendline from the cycle low. RSI at neutral gives no strong signal either way, which puts the weight of this setup entirely on how price behaves at $2,473.91–$2,514.99 in the sessions ahead.
Track ETHUSD and every major crypto pair in real time — live charts, moving average structure, and Elliott Wave bias on one screen with PST Terminal, included with the PST All-Access plan.
—
Disclaimer: This analysis is for educational purposes only and does not constitute financial advice. Trading involves significant risk. Always conduct your own research before making any investment decisions.