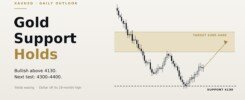


For context on today’s levels, also read our previous gold call, Gold Support Holds at $4,130, and our Nasdaq 100 Forecast: 3 Proven Levels Before 34,000.
Our gold and Nasdaq outlook for Thursday starts with one level: $4,070. Gold is trading near $4,090, down roughly 0.8% to 1% in Asian and early European hours after a fourth straight daily decline, and it is now sitting just above the October double-bottom lows. Nasdaq 100 futures are down about 1.3% near 29,600 after mixed Meta and Tesla earnings, below a trendline that held since April. The one thing that matters most today: whether gold holds $4,070.
Gold and Nasdaq Outlook: Gold Structure and Key Levels
On the higher timeframe, our working count is unchanged. The January 2026 peak near $5,580 completed a large impulsive advance, and gold has been working through a wave 4 correction inside a falling channel since then.
Price Action: A Lower High Under $4,200
The rally that followed failed below the $4,200 psychological level on Monday. Gold was then rejected again near $4,142 on the falling trendline on Wednesday and has since slipped toward $4,090. That is a lower high followed by a retest of the lows. On the daily chart, price is below the 20-day EMA near $4,172 and RSI is around 40, according to FXStreet.
Key Levels
Resistance sits at $4,142 (the trendline), then $4,172–$4,180 (the 20-day EMA and horizontal resistance), and then $4,200–$4,230. Support is $4,068–$4,079, where buyers stepped in twice this month, then $4,053 and the $4,000 psychological level.
Bullish Scenario
Trigger: $4,068–$4,079 holds and gold reclaims $4,142 on a closing basis. Targets: $4,172–$4,180, then $4,200–$4,230. Invalidation: a daily close below $4,053.
Bearish Scenario
Trigger: a daily close below $4,068. Targets: $4,053, then $4,000. Invalidation: a recovery and close back above $4,142.
In wave terms, a clean break of $4,070 would suggest the wave 4 correction is extending rather than ending. The larger uptrend would stay intact, but the bottom would probably not be in.
Nasdaq 100: Broken Trendline, Support Under Test
The cash Nasdaq 100 set a record close at 31,224.69 on October 6, with an intraday high of 31,361.37. It then lost 5.5% last week, its steepest weekly drop since April 2025, and closed at 29,187.55 on October 16. Tesla fell more than 3% after hours on a capex cut, while Meta rose about 2% but raised its 2026 capex range to $135–$145 billion.
Elliott Wave Context
The rally from the April low near 23,550 reads as a five-wave advance in our count. The break of the trendline from that low says the advance is at least correcting. The question is whether this is a wave 4 holding above the July low near 27,500, or a larger A-B-C decline. Until price either reclaims 30,000 or loses 27,500, we treat it as a correction inside a bigger uptrend.
Key Levels (NQ futures)
Resistance sits at 29,935–30,300, where the broken trendline and the 38.2% retracement meet, then 30,500–30,800 and the 31,200–31,500 record zone. Support is 29,000–29,300, then 28,100–28,200 (roughly a 10% correction from the high), then 27,250–27,500.
Bullish Scenario
Trigger: a daily close back above 30,300. Targets: 30,500–30,800, then 31,200–31,500. Invalidation: a close below 29,000.
Bearish Scenario
Trigger: a rally that fails below 30,000 as a lower high, or a daily close below 29,000. Targets: 28,100–28,200, then 27,500. Invalidation: a close above 30,300.
Macro: Yields, Dollar, Fed Odds and the Calendar
Yields and the Dollar
The 10-year Treasury yield is near 5.09%, off its recent highs above 5.3% and down about 3 basis points today. The dollar index is near 101.6, slightly lower and holding close to a three-week low. Both should help gold, but oil is overriding them. Brent is above $110 and WTI is near $99, which keeps inflation risk and rate-hike pricing alive.
Fed Pricing
CME FedWatch, as reported by Kitco, shows about an 83% chance of a hold on October 28 and around 94% odds of a hike by the December 9 meeting. The current range is 3.75%–4.00%.
Calendar
Today: US weekly jobless claims (8:30 a.m. ET), plus Procter & Gamble and Lockheed Martin earnings. Friday: flash October PMIs and final University of Michigan sentiment. Next week: Microsoft and Alphabet earnings, followed by the FOMC decision on Wednesday, October 28.
Follow-Up on Previous Calls
Gold (October 17, published at $4,165): Not triggered, weakened, not yet invalidated
We called gold bullish above $4,130 and set a 4-hour close above $4,205 as the trigger, with targets at $4,267–$4,277 and $4,300–$4,400. The trigger never fired (the rally stalled below $4,200), so no target was reached. Gold then closed below $4,130, which we had said would weaken the setup, and price is now in the neutral zone we defined. Invalidation was set below $4,070. It has not been hit yet, with price about $20 above it.
Nasdaq 100 (September 27, published at 30,889): Partial, target missed
The setup called for a breakout above the range high toward the 34,000 channel top. The index did make a new record in early October, but the breakout did not follow through. The 34,000 target was missed, and NQ is back below 30,889 in the neutral zone. The invalidation level, a weekly close below 26,352, has not been hit.
Summary
XAUUSD near $4,090:
🟢 Bullish above $4,142, toward $4,172–$4,230
⚠️ Neutral between $4,068 and $4,142
🔴 Invalidated below $4,053, opening $4,000
NQ near 29,600:
🟢 Bullish above 30,300, toward 30,800 and then 31,500
⚠️ Neutral between 29,000 and 30,300
🔴 Invalidated below 29,000, opening 28,100 and then 27,500
Both instruments are at support in front of a Fed meeting where a December hike is close to fully priced. Let the levels confirm before committing, and keep size small.
Full Elliott Wave counts, entries and stops go to PST All-Access members first → https://prosignaltrades.com/setup/
—
Disclaimer: This analysis is for educational purposes only and does not constitute financial advice. Trading involves significant risk. Always conduct your own research before making any investment decisions.