For related setups, also read our Bloom Energy Bearish Setup and our Nasdaq 100 Forecast.
The INTU double bottom is the structure that now matters most on the Intuit chart. The stock trades at $302.11 after a 52.2% decline over the past year — down from an $815.73 high to a $250.60 low — and it is the behaviour at that low, not the size of the drawdown, that decides what comes next.
What makes this setup worth attention is that the technical and the fundamental case have arrived at the same place at the same time. Price is testing a major Fibonacci level while the company trades at 13x forward earnings with an 81% gross margin. That combination is rare, and it is also exactly where the argument gets interesting — because the reason the stock fell is not fixed.
INTU Double Bottom — The Structure Forming at $250.60
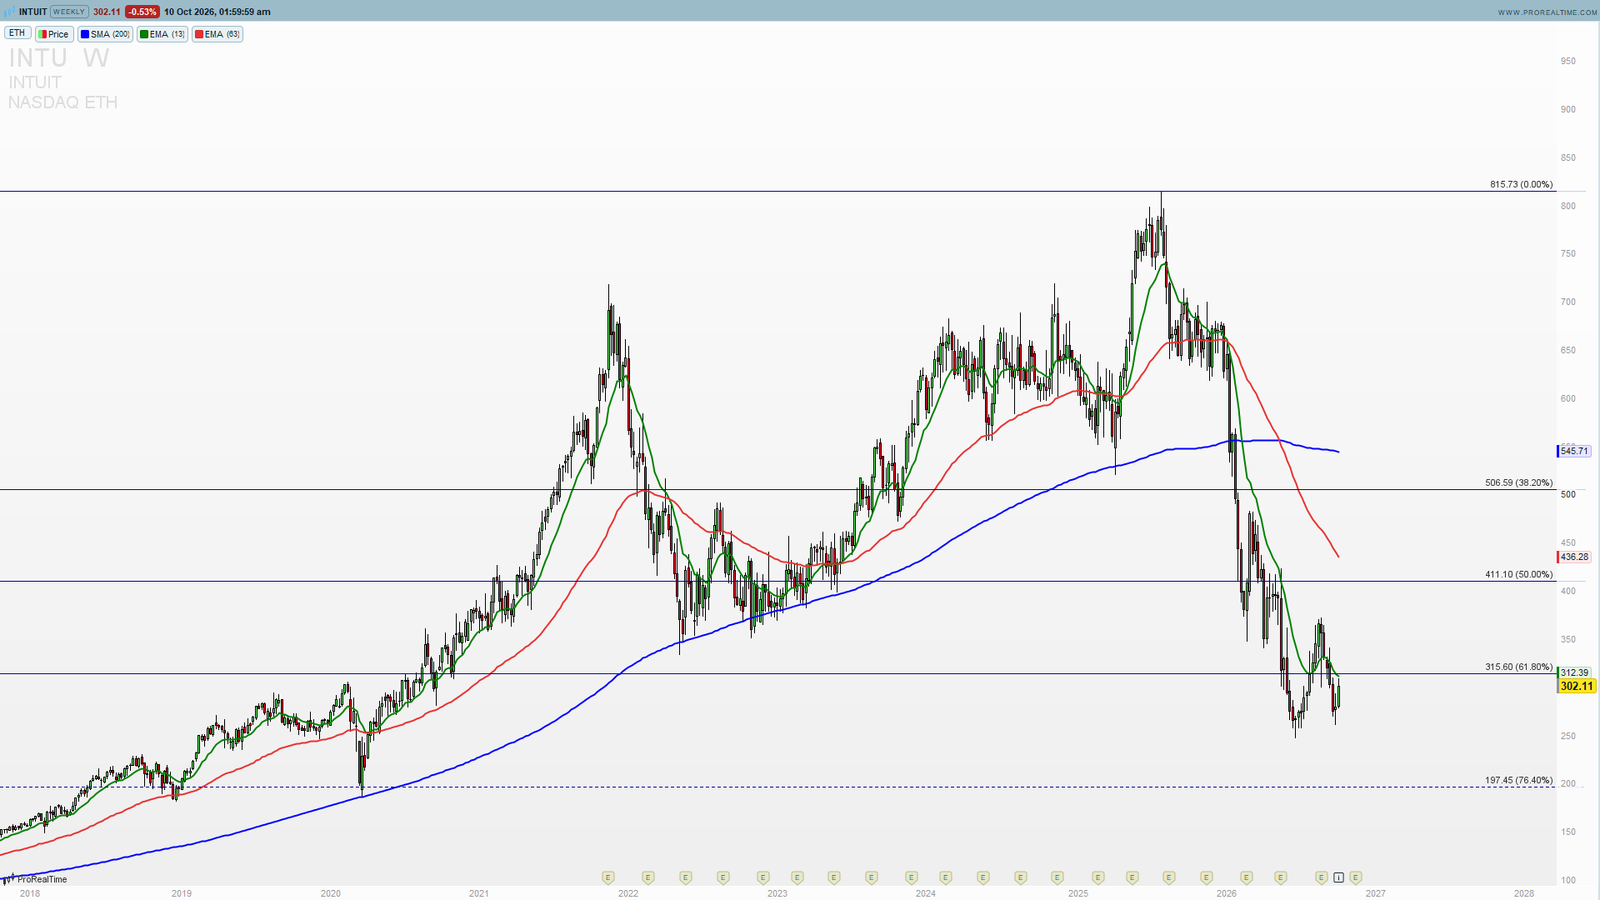
The weekly chart shows the decline from the $815.73 top running almost without pause into $250.60, which marks the 52-week low. From there price rallied to roughly $340 before rolling back over. Intuit is now at $302.11, working back down toward the low in what reads as the second leg of a potential double bottom.
The 61.8% Retracement Is the Line Under Price
Measured from the $815.73 high, the 61.8% retracement sits at $315.60 — and price is trading just below it, at $302.11, with the EMA(13) at $312.39 essentially on the same level. That cluster is the immediate overhead resistance. Reclaiming it is the first thing bulls need before any reversal thesis gets weight.
This Is a Pattern Forming, Not a Pattern Confirmed
A double bottom is not complete until the neckline breaks. Here the neckline is the interim high near $340. Until a weekly close clears it, this remains a retest of the low inside a downtrend — and most retests of this kind fail. Anyone treating the current price as a confirmed reversal is front-running the pattern, not trading it.
The Longer-Term Averages Are Still Overhead
The SMA(200) on the weekly sits at $545.71 and the EMA(63) at $436.28. Both are far above price and both are falling. That is the honest context: the primary trend is still down, and what we are discussing is a counter-trend base, not a resumed uptrend.
Intuit Fundamentals — Why the Stock Fell 52%
The drawdown was not an earnings miss. Intuit delivered FY26 revenue of $21.4 billion, up 14% year-over-year, with both GAAP and non-GAAP diluted EPS growing 20%, and non-GAAP operating margin expanding 1.5 percentage points to 41.7%. The company repurchased $5.5 billion in shares during the year, up 96%, cutting the share count from 280.1 million in 2023 to 267.2 million.
The Problem Is Customer Count, Not Revenue
Shares fell roughly 8.69% after hours on the Q4 print for one reason: total online paying customers grew only 3% year-over-year. Revenue is growing because each customer pays more, not because there are meaningfully more customers. CEO Sasan Goodarzi said plainly that price is now the number one reason customers leave TurboTax — which is management confirming the bear case rather than disputing it.
Guidance Implies a Deceleration
FY27 revenue guidance of $23.3–$23.5 billion implies 9–10% growth, down from 14%. Management has framed FY27 as a deliberate ‘J curve’ — accepting lower near-term revenue per customer to rebuild the DIY tax funnel and reaccelerate customer acquisition. That is a credible strategy and also an admission that the next twelve months get worse before they get better.
Valuation Has Compressed to a Level That Prices Trouble In
INTU now trades at a trailing P/E of 17.8 and a forward P/E of 13.0, with a PEG ratio of 0.85 and a free cash flow yield of 10.7%. Against peers, the compression is stark: Paychex trades at 20.6x and Workday at 36.2x. Intuit’s gross margin is 81.0% and return on equity 23.6%. The dividend yields 1.82% and has been raised for 16 consecutive years. Investors can follow live INTU price action and analyst ratings on MarketBeat, and the company’s own disclosures are published at Intuit Investor Relations.
The Analyst Community Is Split and Still Cutting
JPMorgan and Bank of America both downgraded to Neutral after the print, and 21 of 22 analysts revised EPS estimates downward over the past 90 days. Targets now run from $290 at the low to $500 at the high, with a median of $405.60. A median target 34% above spot alongside near-universal downward revisions is the market saying the business is cheap but the direction is still wrong.
INTU Key Levels — What a Break Above $340 Would Open
The confluence here is unusually clean: a major Fibonacci level overhead, a defined low beneath, and a neckline that settles the question.
Immediate Resistance: $315.60
The 61.8% retracement from $815.73, reinforced by the EMA(13) at $312.39. The first level price has to reclaim and hold.
Neckline — The Level That Confirms: $340
The high of the bounce off $250.60. A weekly close above it completes the double bottom and projects a measured move toward roughly $429 — which lands directly on the EMA(63) at $436.28 and just above the 50% retracement at $411.10.
The Low That Must Hold: $250.60
The 52-week low and the second bottom of the pattern. A weekly close below it invalidates the setup entirely and opens the 76.4% retracement at $197.45.
Longer-Term Resistance: $411.10 → $506.59
The 50% and 38.2% retracements, with the falling SMA(200) at $545.71 above both. These only come into play if the neckline breaks with follow-through.
What to Watch Before December 1
The Q1 FY27 Report
Intuit reports on December 1, 2026. The number that matters is not revenue — it is online paying customer growth. If that 3% figure improves, the J curve thesis gains evidence and the base has a fundamental reason to hold. If it deteriorates, the $250.60 low will be tested properly.
Confirmation Requires Follow-Through
One weekly close above $340 is a signal; two consecutive closes above it with the EMA(13) turning up is confirmation. Until then this is a base under construction, and bases under construction fail more often than they complete.
INTU Summary
Intuit at $302.11:
🟢 Bullish above $340 — double bottom confirmed, measured move toward $429
⚠️ Neutral between $250.60 and $340 — base forming, no directional edge until the neckline resolves
🔴 Invalidated on a weekly close below $250.60 — opens the 76.4% retracement at $197.45
Intuit is a high-margin, cash-generative business trading at 13x forward earnings after a 52% drawdown, and the chart has built a potential double bottom at exactly the level where that valuation starts to matter. But the pattern is unconfirmed, the primary trend is still down, and management has told the market the near term gets harder before it gets easier. The structure rests on two numbers: $340 above and $250.60 below. Everything between them is noise.
Get the Full INTU Research Report — €299 Annual, Locked for Life
This post covers the setup. The full institutional-grade research report on Intuit — forward estimates, peer benchmarking, segment detail, cash flow analysis and position sizing guidance — is part of the PST research library, included with PST All-Access.
Until October 24, the annual plan is €299 instead of €399 — and that price stays locked on every future renewal, even when the standard price goes up. That is €24.92 per month against €69 on the monthly plan.
All-Access includes the PST Terminal with live charts and news, the Elliott Wave and ICT scanners, the full institutional research library, Telegram signals and WhatsApp alerts.
Use code IMPULSE at checkout → prosignaltrades.com/setup/
30-day money-back guarantee, no questions asked.
—
Disclaimer: This analysis is for educational purposes only and does not constitute financial advice. Trading involves significant risk. Always conduct your own research before making any investment decisions.</p