Fundamental overview
The Backbone of Gold Pricing: Real Yields and Interest Rates
No single variable has a stronger influence on gold than real interest yields, particularly the U.S. 10-year TIPS. The relationship is almost perfectly inverse:
-
Rising real yields put downward pressure on gold, as non-yielding assets become less attractive.
-
Falling real yields act as a tailwind, often resulting in sustained gold rallies.
With markets now pricing a gradual Federal Reserve easing cycle into 2025, the medium-term environment leans supportive for gold—though persistent inflationary pressures may create short-term volatility in yields.
One of the most important shifts in modern gold fundamentals is steady accumulation by global central banks, particularly in Asia, the Middle East, and emerging markets.
China, Turkey, India, Poland, and several Gulf nations have consistently increased reserves, often citing diversification away from dollar assets and geopolitical risk management.
This steady demand has created a firm price floor, allowing gold to remain elevated even during periods of ETF outflows in the West.
Investment appetite through ETFs like GLD and IAU remains a critical indicator of Western investor sentiment.
-
ETF inflows signal rising investment interest, often associated with bull cycles.
-
ETF outflows tend to weigh on prices, particularly when combined with rising yields.
Interestingly, the last 2 years showed persistent ETF outflows, yet gold remained strong—highlighting the influence of central bank buying. A reversal in ETF flows could become a catalyst for the next significant upside wave.
Gold’s fundamental landscape in 2025 remains compelling. The convergence of falling real yields, ongoing central-bank accumulation, geopolitical tensions, and structural shifts in global monetary architecture creates an environment that favors medium-term and long-term bullishness. Short-term volatility will continue to be dictated by the strength of the U.S. dollar, Fed communications, and inflation readings, but the broader cycle remains intact.Will the Gold panic buying at these levels pay off?
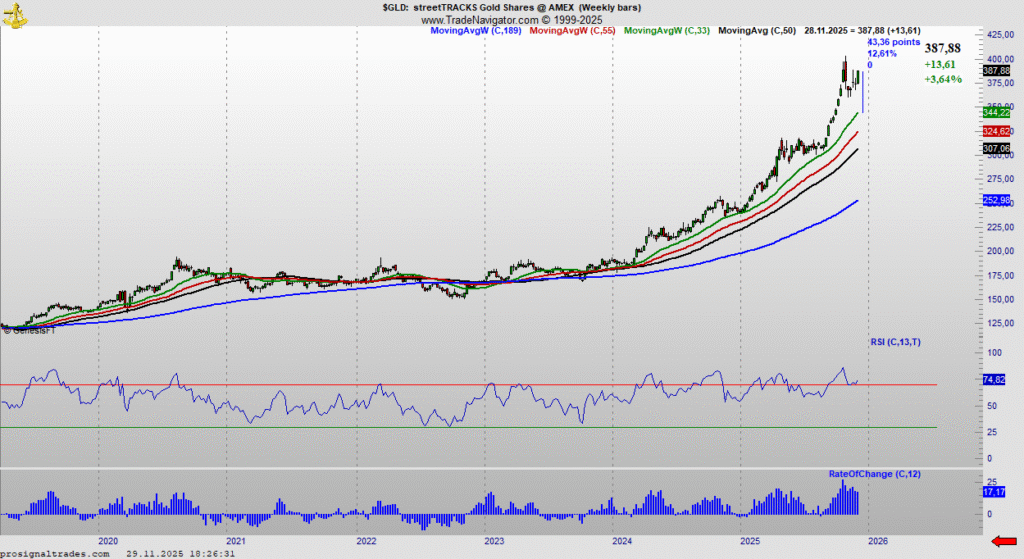
Gold and Silver sector Index is having its best quarter after quarter. It is now amazing 42% above the previous high reached in March 2010 just before the following crash. As we have some resistance here a long-term uptrend line it can have some headwinds here. I would say much needed as the upside acceleration has been amazing but is also attracting the easy profit taking reversal is certain point.
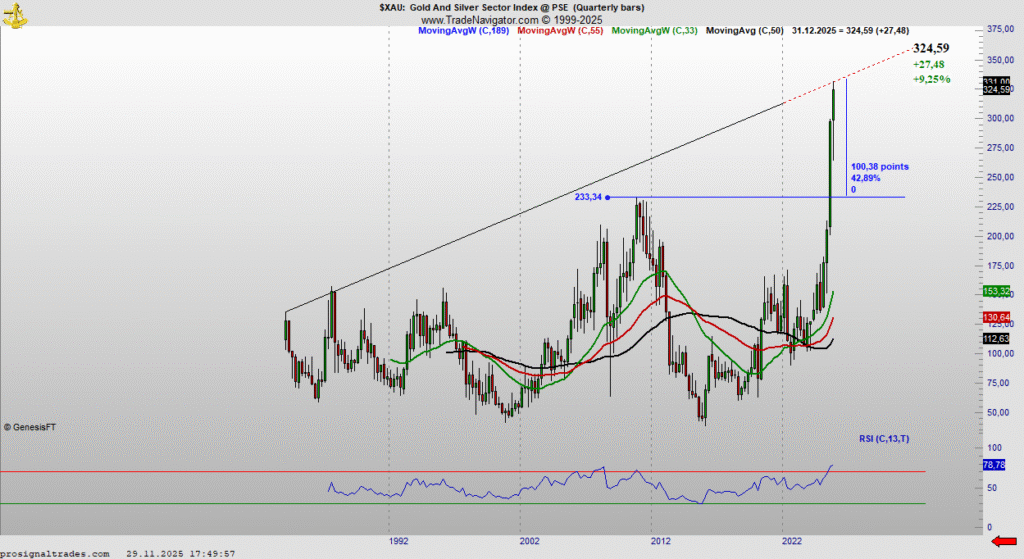
Gold reached 1.786% Fibonacci extension from the low in 2001 a 4400 level and has pulled back. It has closed above 4200 in November as you can see on the monthly chart below. RSI is at the extreme level even on the monthly chart period. Panic buying is on but it can go against the buyers at this level.
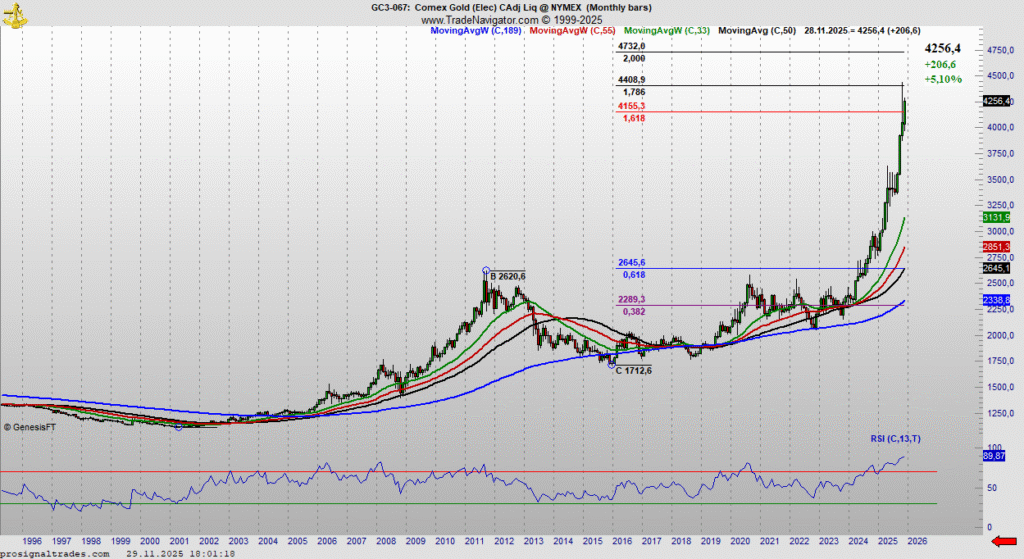
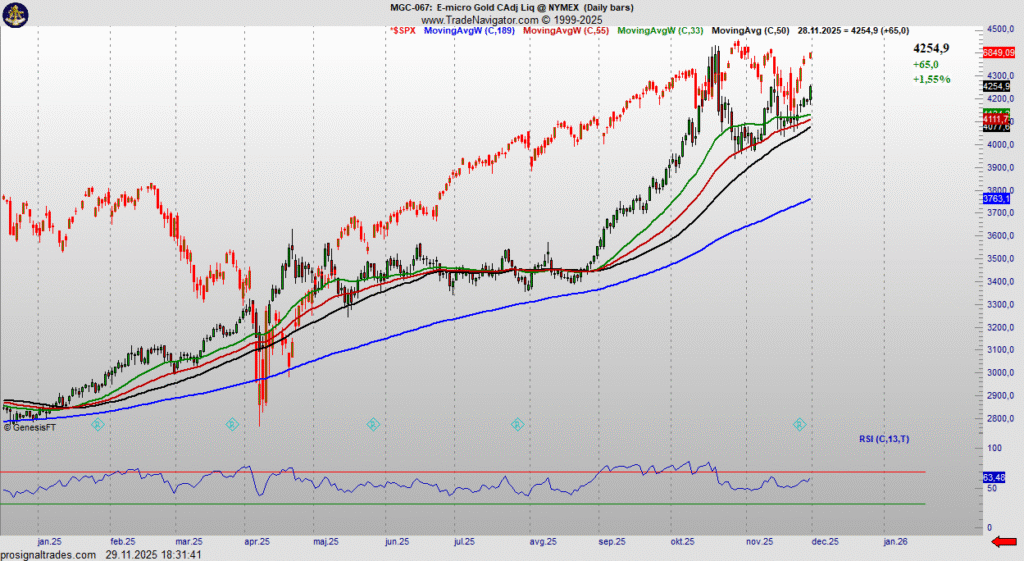
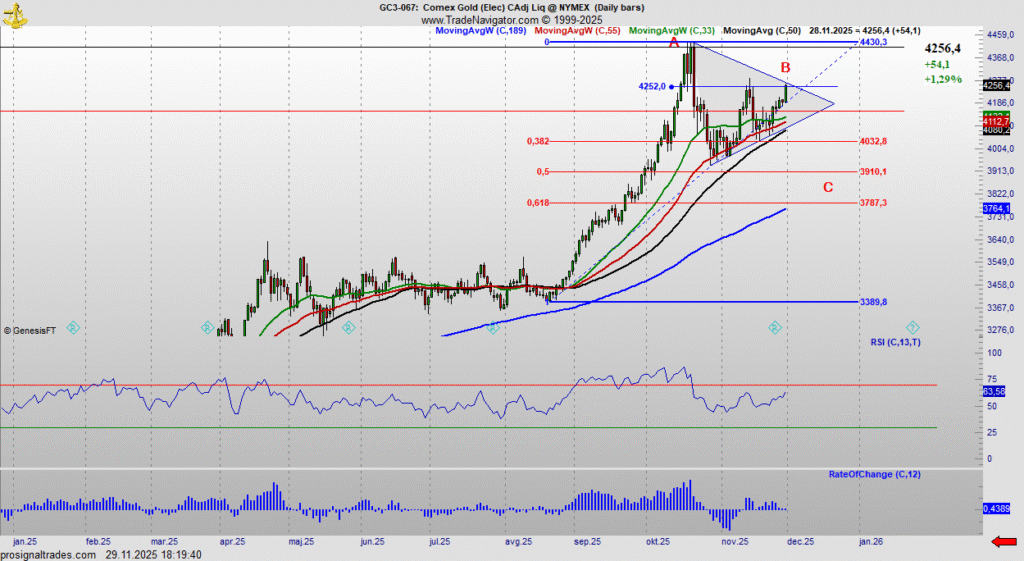
Although we had on Friday strong bullish day the upside 4250 resistance was not broken (join to get premium analysis and everyday updates Black Friday 50% off). 75000-80000 zone is ultimate short target and a possible major long-term buying zone.
Gold is in the ABC correction still, with the current level could be (B) before an extension lower to ideal pullback level 3787 which is also 61.8% Fibonacci retracement of the August-October 2025 parabolic rise. That is the level I am looking for to buy and enter a new cycle of the uptrend which can carry Gold near 5000.
As you can see short-term we have options. GLD ETF is far away from the moving averages. This is the highest distance 12.61%. This is “heated” market reaching a extreme and we could see a huge reversal from this levels short-term as the Gold also has now direct correlation with stocks (chart below when SPX (red candle) goes upside Gold goes upside too). Buyers from a lower levels should take some profit here.