For related analysis, also read our Nasdaq 100 Forecast and our Oil Breakout Analysis.
Market complacency is not a feeling — it is a measurable gap between what one asset class is pricing and what another is ignoring. Right now that gap is unusually wide. The bond market is repricing at a speed not seen in two decades. Credit positioning is quietly rotating out of Europe. And equity volatility is sitting near a one-year low, as though none of it were happening.
This is not a crash call. Nothing in the data says a drawdown is imminent. What the data does say is that the compensation for holding equity risk has rarely been thinner relative to what the rest of the market is signalling — and that is a setup worth understanding before it resolves, not after.
Signal 1 — Bond Yields at Levels Not Seen Since 2007
The move in rates has been the dominant macro story of the quarter. The US 10-year Treasury yield held just below 5.2% in late September, near its highest level since 2007, while the 30-year stood around 5.48% — its highest since 2004.
The composition matters more than the level
This is not an inflation-expectations story. Real yields are doing the heavy lifting: the 10-year real yield sits at 2.6% and the 30-year real yield above 3%, both at post-GFC highs — with the 10-year real yield more than double its 2000–2020 average and above most estimates of trend US growth.
That distinction is the entire point. Rising nominal yields driven by inflation expectations can coexist with rising equity prices, because nominal earnings rise too. Rising real yields are different — they tighten financial conditions directly, raise the discount rate applied to future cash flows, and compress the premium investors earn for owning equities over risk-free assets. The same analysis puts it plainly: the higher real yields climb, the greater the chance something breaks in the real economy or in risk assets.
Signal 2 — Rates Volatility Spiking, Equity Volatility at Lows
This is the sharpest divergence on the board, and the one most worth watching.
Europe tells the same story
The VSTOXX — the Euro Stoxx 50 volatility index — has been trading in the 17 to 18 region, with a 52-week range running from 14.05 last December to 34.78 at the March peak. In other words, mid-range. European equity volatility is not pricing stress either, despite the eurozone’s greater sensitivity to the energy and rate backdrop currently driving the bond market.
Beneath the index, dispersion is building
One detail in the Cboe data deserves attention: while index-level volatility was flat, single-stock volatility rose further, with the VIXEQ index climbing another 2 points to 38.5%. Index calm masking single-stock turbulence is a familiar late-cycle signature — correlation falls, the index absorbs the noise, and the aggregate reading understates what individual positions are actually experiencing.
Signal 3 — Credit Positioning Rotating Out of Europe
Headline credit spreads are tight, and that is worth stating clearly rather than dressing up. The brief widening earlier in 2026 — roughly 80bps on European high yield during the February–March conflict escalation — has largely reversed. Investment grade spreads sit near multi-decade tights. On the surface, credit looks calm.
Positioning tells a different story than pricing
Beneath the spread level, flows have been moving. DTCC position data shows a clear rotation out of European investment-grade credit — iTraxx Main net longs down $3.8 billion — toward US credit, with CDX IG net longs up $6.8 billion and CDX HY up $3.7 billion, against a backdrop of oil near $100 per barrel, a level historically associated with widening European credit spreads.
Europe’s greater sensitivity to energy prices is the mechanism here. Spreads have not widened yet. But the money that would be hurt by widening is already moving — and positioning usually leads price, not the other way around.
Where European Equities Actually Sit
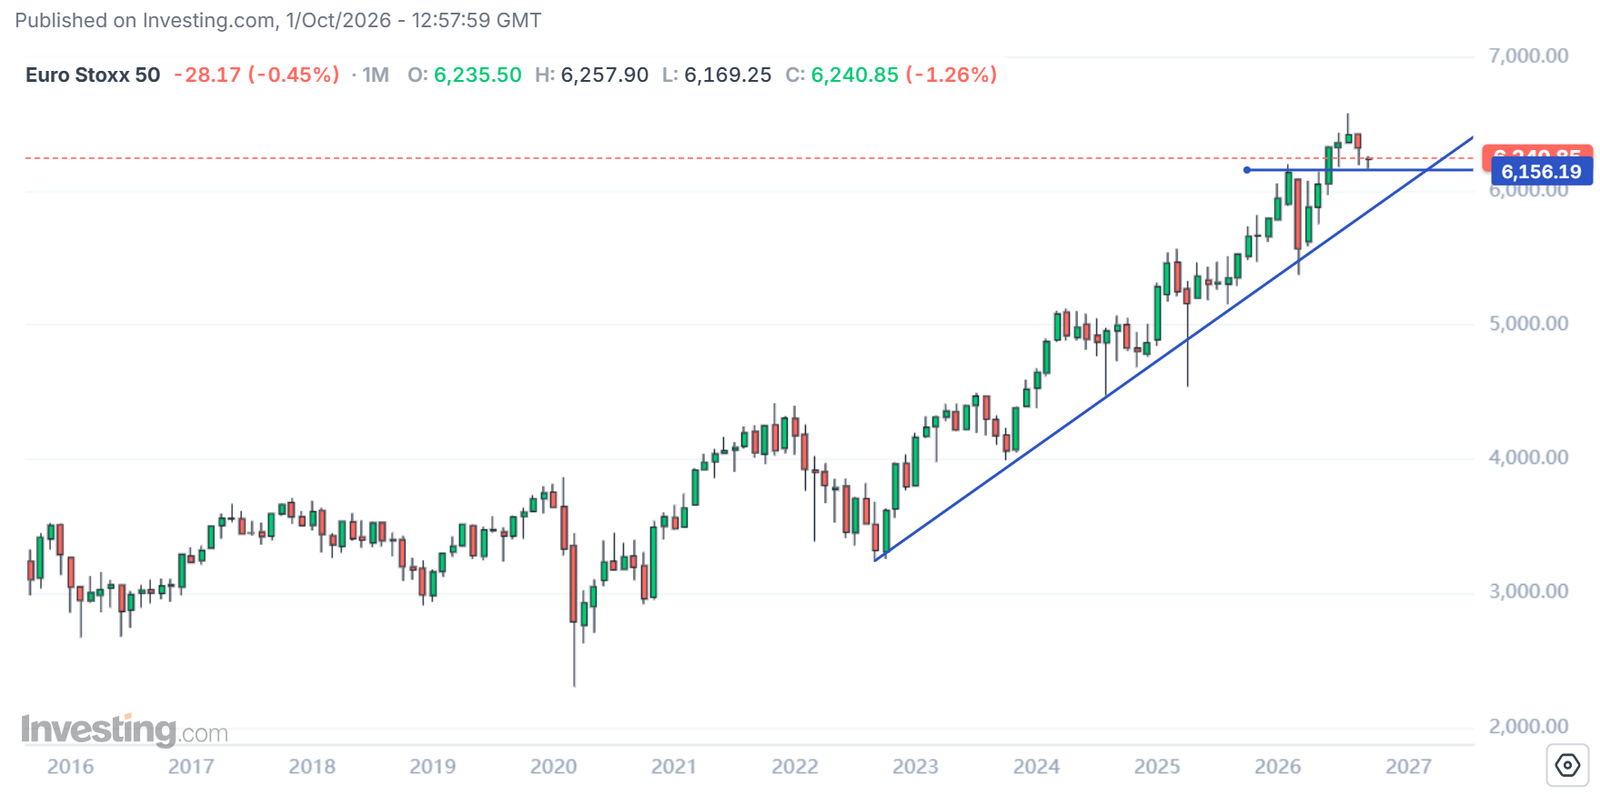
It is worth correcting a common framing: the Euro Stoxx 50 is not sitting on make-or-break support. The index closed September near 6,269, against a 52-week range of 5,376.81 to 6,577.20 — roughly 4.5% below its high and firmly in the upper portion of its range.
That is precisely what makes the setup interesting rather than alarming. European equities are near highs, equity volatility is cheap, credit spreads are tight — and the bond market is simultaneously repricing at two-decade extremes while credit money rotates away from the region. The divergence is not that equities are breaking. It is that they are not reacting at all.
What to Watch
The VSTOXX 20 level
A sustained move above 20 would be the first sign European equity volatility is beginning to price what rates and credit positioning have already begun to price. Below that, complacency persists.
Oil above $100 sustained
This is the specific trigger cited in the credit positioning data. A durable move above that level is the most likely catalyst for European spreads to follow the positioning that has already shifted.
Real yields rather than nominal
Watch the 10-year real yield, not the headline. Further advances from 2.6% tighten conditions regardless of what inflation expectations do — and that is the channel through which bond stress transmits into equity multiples.
Single-stock versus index volatility
If the VIXEQ–VIX gap continues widening into Q3 earnings, index-level calm is increasingly an average concealing significant underlying dispersion.
Summary
The cross-asset picture:
🔴 Bonds — 10-year near 5.2%, 30-year near 5.48%, real yields at post-GFC highs, rates vol near one-year high
⚠️ Credit — spreads tight, but positioning rotating out of European IG with oil near $100
🟢 Equities — SX5E near the upper end of its 52-week range, VIX near a one-year low, VSTOXX mid-range
Three markets, three different readings of the same macro environment. One of them is wrong, and historically the bond market is not usually the one that gets it wrong first. That does not make a correction imminent — complacency can persist far longer than it should, and being early is indistinguishable from being wrong in the meantime. But it does mean the compensation for carrying equity risk is unusually thin right now, and that hedges have rarely been cheaper than they are today.
The practical takeaway is not to sell everything. It is to know which level invalidates the calm — and to decide what you will do before it does, rather than during.
Track cross-asset structure in real time — live charts, volatility context, Elliott Wave bias and institutional research across indices, rates, commodities and equities on one platform with the PST All-Access plan, backed by a 30-day money back guarantee.
—
Disclaimer: This analysis is for educational purposes only and does not constitute financial advice. Trading involves significant risk. Always conduct your own research before making any investment decisions.