NVDA fundamental overview
Growth drivers: NVDA leadership in AI inference/training, expansion into telecom (6G), automotive (robotaxi/autonomous), and industrial (digital twins) all provide growth levers beyond traditional datacentre.
Risk factors: Export controls (especially China), supply chain constraints, competition (e.g., Advanced Micro Devices, Intel Corporation), and the challenge of converting hype into profitability are key risks.
Valuation caution: With the market cap at ~$5T, the stock is priced for “extended dominance”. Any hiccup in execution may trigger sharp moves.
Catalysts ahead: Earnings release (next one scheduled for 19 Nov) and any updates on export-policy/China access. Also watch how much revenue comes from the newer segments (auto, telecom, industrial) vs the datacentre core.
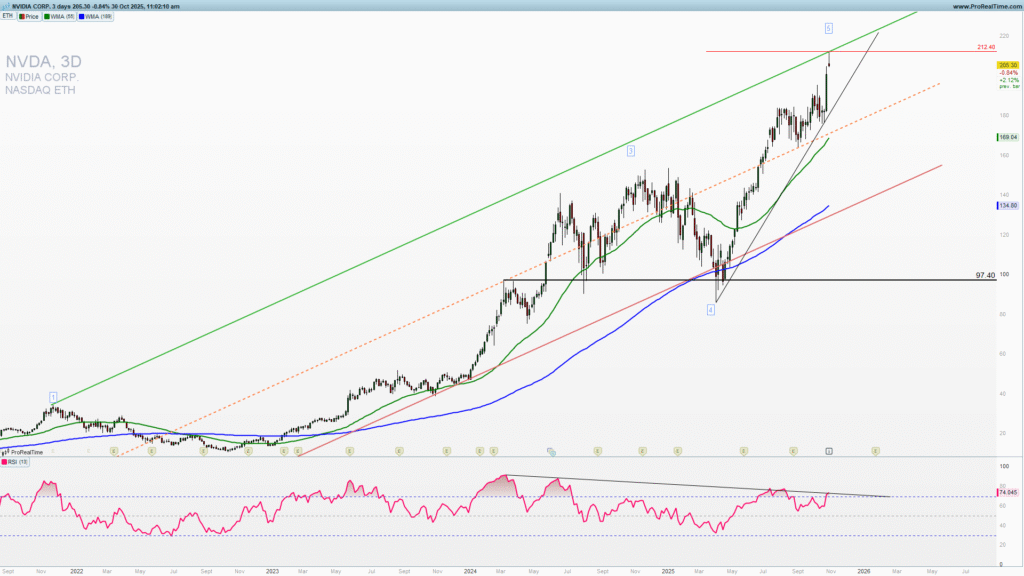
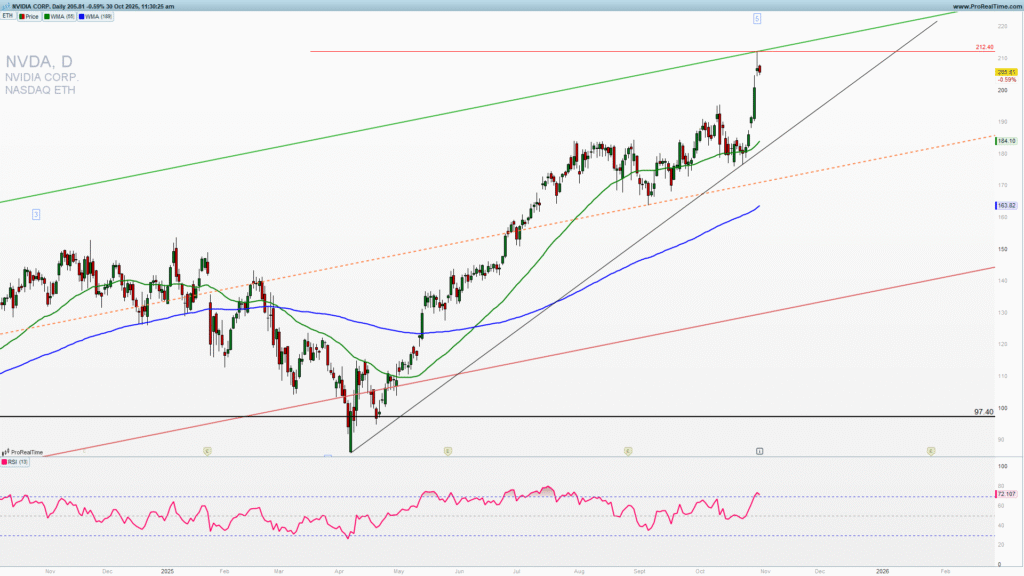
NVDA reached 207 level which is the high of an almost three years uptrend channel and this level could be market as the final fifth wave. This should produce a correction lower if not a deeper pullback as we move forward. Increasing competition in the industry and limits for China export are making this NVDA valuation high. Risk reward for buyers of the NVDA here is low and downside risks are rising.
Medium-term top?
We could argue that AI boom does not exist yet, but by looking at the data and market breadth we can see that a low percentage of stocks is driving the market higher. NVDA is among those stocks and did benefited a few points higher after the Trump-China tensions easing.
NVDA reached the highest channel point of the multi-year channel upside on a big negative RSI divergence. RSI is not confirming the new high over the period. I am not taking this indicators or any other by itself as an indication of the top but overall research indicates that medium-term we are at the correction point.
As long as the 212 level is holding I will look it as the top at this point and look for the short trade entries and buying the put options. I would wait for a long trade entries in the zone between 150-170 (join to get premium analysis and everyday updates). This fifth wave alone has five minor upside waves and that gives a confidence in the trading strategy.
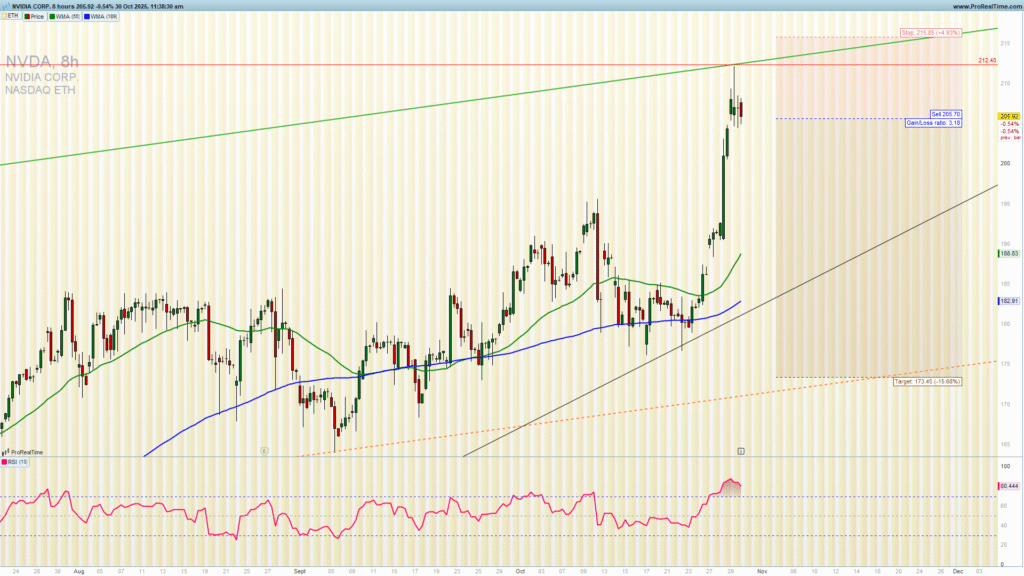
Let’s do some swing trading!
Looking at the 8h chart, and taking into an account all the momentum, price action and waves along with quantitative data my preferred strategy is short trade. You can take short trade with the stop above yesterday high 29.10.2025. to target the short-term uptrend line 170-180 zone. There is a possibility of an extension lower and in that case take half or the 2/3 of the position and release the rest risk-free!