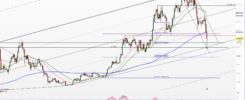
Silver uptrend is still intact
-
According to the Silver Institute, global silver demand is expected to remain steady in 2026, with retail investment rising strongly, helping offset declines in jewelry and industrial use. Supply is forecast to grow modestly — leaving the market in a structural deficit for the sixth consecutive year.
-
Retail investors continue to pour money into silver ETFs even as prices plunged. Over a recent six-day span, retail inflows into the largest silver ETF (SLV) topped $430 million, highlighting strong speculative interest despite the volatile price action.
-
Markets experienced quick sharp selloffs mid-week, with gold and silver both posting sudden intraday losses — a sign of ongoing high volatility.
-
Precious metals (including silver, gold, PGMs) continued to register strong weekly price swings, driven by macroeconomic news and risk sentiment.
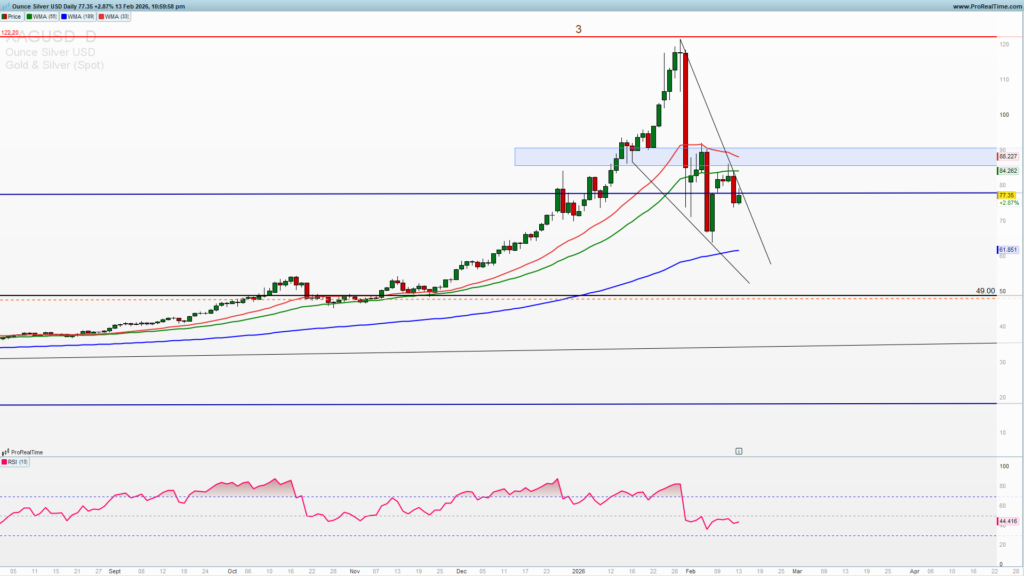
Silver rejected from the top
Silver reached a parabolic top of 122 and has been rejected. This cause a sharp reversal back into the long-term uptrend channel beneath 80. Silver bulls lost momentum due to a strong take profit and short covering as many investors got scared because of a sharp parabolic rise. That reasoning is completely justified looking at the price action and historical tops in 1980 and 2011.
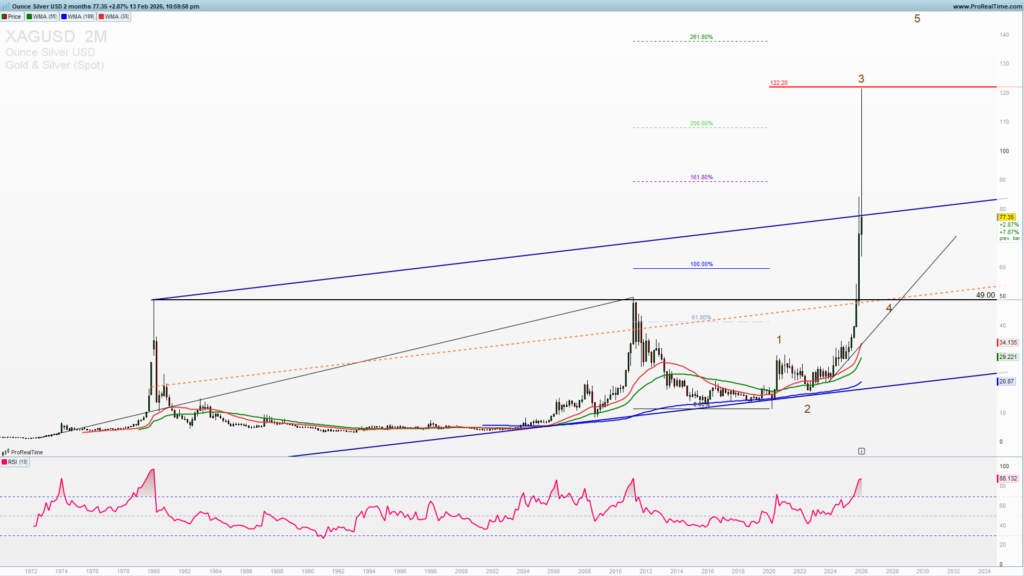
Is this a critical turning point
Silver is rotating higher from 64 as you can see on the weekly chart. This rotation is still weak as we have a strong rejections in the past two weeks from 85-90 zone. This zone is now critical for an upside continuation or another swing lower to 55.
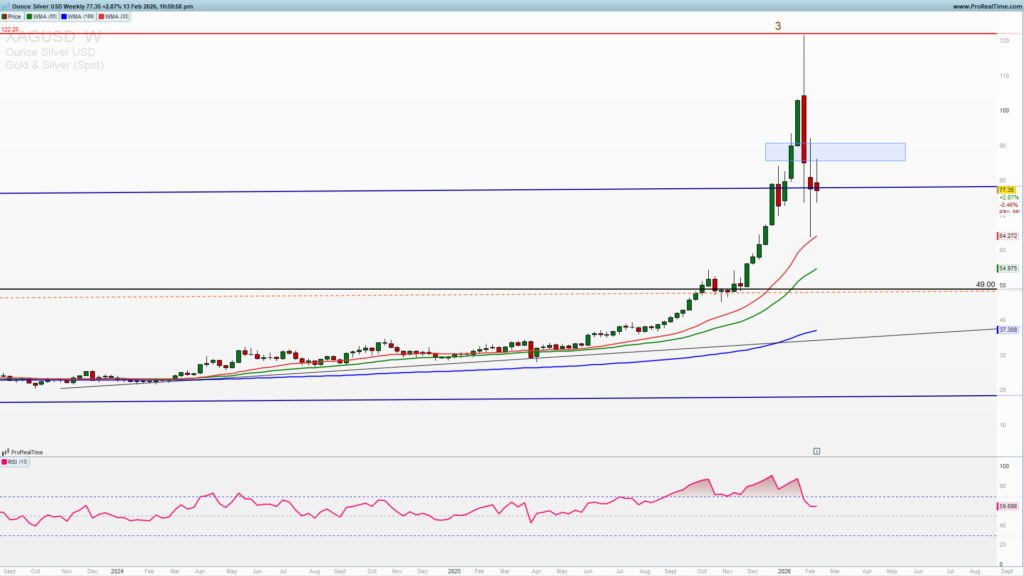
On the weekly chart you can see a strong bounce level 65 (join to get premium analysis, weekly and mid-week newsletter and other tools for for your successful trading 30% discount) indicated on the long-term chart. A break above 90 and a weekly close above this level is needed for an extension higher.
Trade this setup with my preferred broker 👇
On a daily chart visible is a declining wedge which can lead to an acceleration higher, the only question is will we see a new test of the lower wedge support level 55. If we get an impulsive break above the upper wedge resistance 90 that will increase the probability of a continuation higher. Look for a breakout confirmation on the lower timeframes.
Plan your trades in both directions in line with your risk profile and account equity

Trade safe!