For related setups, also read our Gold Bearish Setup and our Cross-Asset Complacency Analysis.
The SLV forecast is corrective, not bearish in the structural sense. The iShares Silver Trust closed at $54.69, down 0.98%, deep inside a wave 4 pullback from the $110 wave 3 peak. Price is trading below equilibrium, bias is bearish, and there is unswept liquidity sitting beneath the market.
That combination points to one specific scenario: a sweep of the lows toward $49.61 before the wave 5 advance begins. This is a setup where the near-term path and the longer-term direction point in opposite directions — and knowing which one you are trading is the entire difference.
SLV Forecast — Wave 4 Still Unfinished
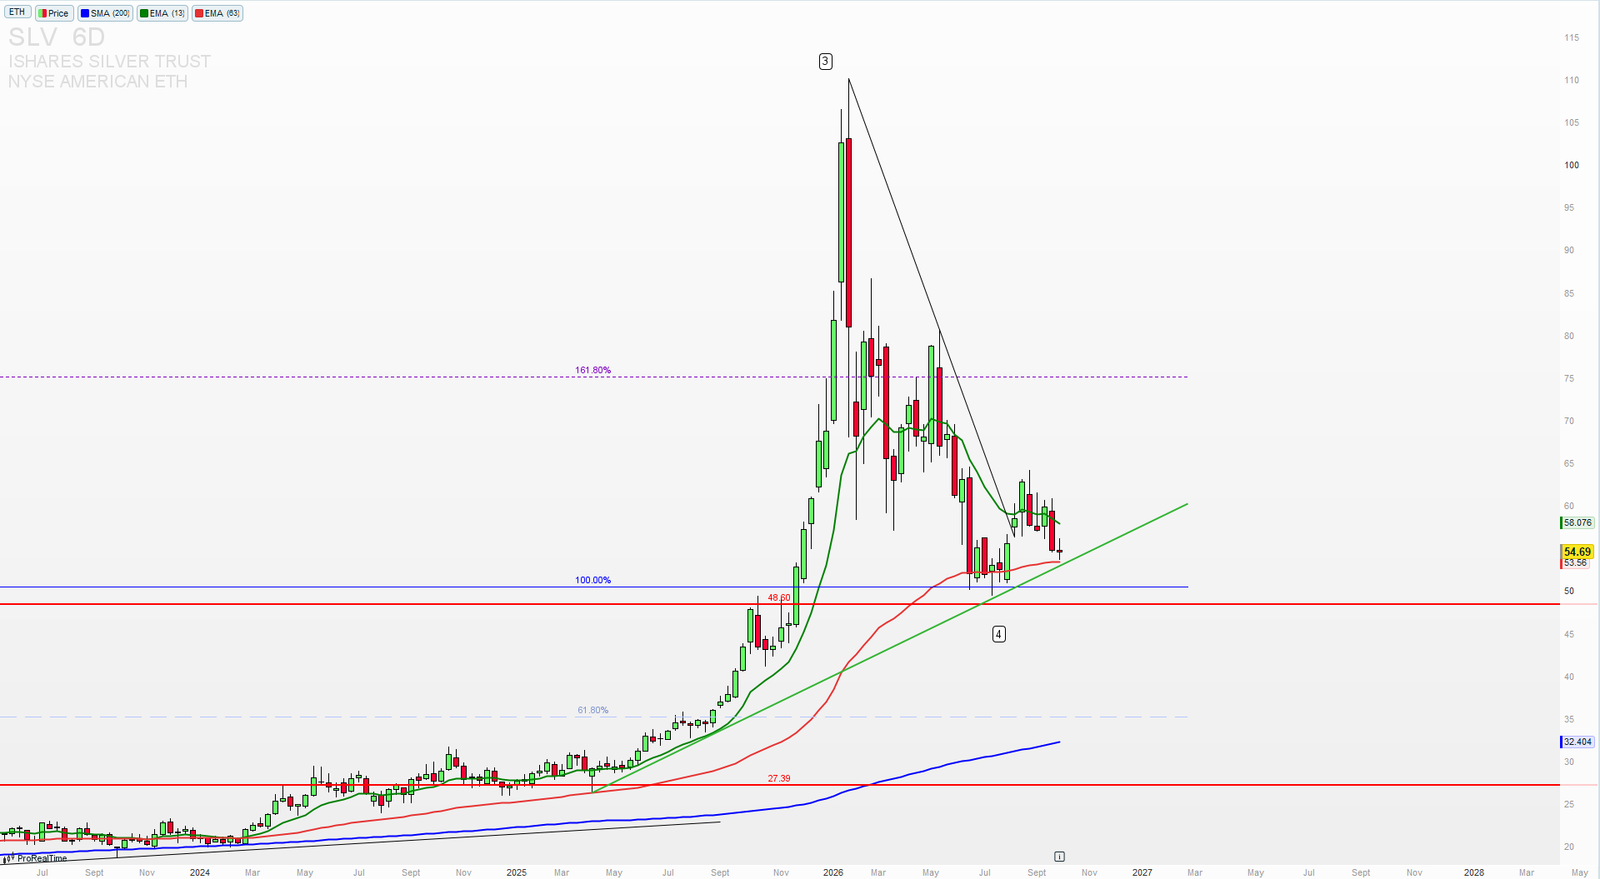
The 6-day chart shows the full cycle: a powerful wave 3 advance that peaked near $110 in early 2026, followed by a correction that carried price down to the $48–50 area, where the wave 4 label sits. The bounce off that low reached roughly $65 before rolling over again, and price is now back at $54.69.
The Moving Average Stack Is the First Tell
Price sits below the EMA(13) at $58.08 but is pressing directly against the EMA(63) at $53.56. That is a market caught between its short-term and medium-term averages — no trend, just a range being resolved. Far below, the SMA(200) at $32.40 is still rising, which is the context that matters: the primary advance has not been broken by this correction.
Fibonacci Confluence at the Lows
The 100% retracement sits at $48.60, almost exactly where the wave 4 low formed and where the horizontal support line is drawn. The 161.80% extension at roughly $75 marks where the wave 3 advance exhausted. Between them, the rising trendline from the 2024 base is now converging with price — support is building beneath the market even as momentum points lower.
Learn the Method — The Gold Count →
What the ICT Scanner Shows
Running SLV through the ICT Scanner produces a precise read of where the market sits inside its dealing range, and it reinforces the wave count rather than contradicting it.
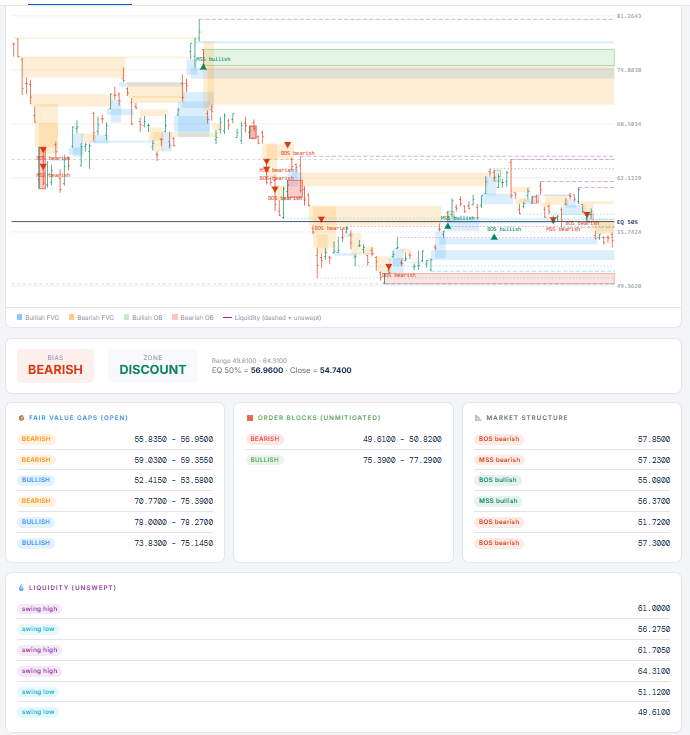
Bias: Bearish · Zone: Discount
The range runs $49.61 to $64.31, placing equilibrium at $56.96. With price at $54.74 on the close, SLV is trading below the midpoint — in discount. Bearish bias in a discount zone is the signature of a correction working toward its final flush, not of a market in free fall.
Immediate Resistance Is an Unfilled Bearish Gap
An open bearish fair value gap sits at $55.84–$56.95, directly overhead and capped precisely at equilibrium. That is the first thing any rally has to clear, and the fact that it aligns with the 50% level makes it the cleanest invalidation marker on the chart. A second bearish gap sits higher at $59.03–$59.36.
Unswept Liquidity Sits Below
This is the most important detail in the scan. Two swing lows remain unswept: $51.12 and $49.61. Below them sits an unmitigated bearish order block at $49.61–$50.82. Unswept lows beneath a market in discount with bearish bias are a magnet, not a floor.
Market Structure Is Net Bearish
The most recent breaks are bearish: BOS at $57.85, MSS at $57.23, and an earlier BOS at $51.72. The bullish structure points at $55.08 and $56.37 have already been overtaken. Structure confirms what the bias reading says.
SLV Key Levels — The Three That Matter
1. Equilibrium and the Bearish FVG: $55.84 – $56.96
The level that defines the setup. While price stays below this band, the discount read and the case for a liquidity sweep remain intact. A decisive close above it flips the structure to premium and invalidates the downside scenario.
2. The Bullish FVG and EMA(63): $52.42 – $53.58
The first support zone beneath price, where an open bullish gap and the medium-term average overlap. A reaction here would delay the sweep; a clean break through opens the path to the lows directly.
3. The Liquidity Pool: $49.61 – $51.12
The two unswept swing lows plus the unmitigated bearish order block at $49.61–$50.82, converging with the 100% retracement at $48.60 and the wave 4 low. This is the target zone — and structurally, the logical place for wave 4 to complete and wave 5 to begin.
Why the Longer-Term Case Stays Constructive
A move toward $49 would look dramatic on a chart. It would not break the structure.
The SMA(200) sits at $32.40 and is rising. The 2024 trendline is converging with price from below. A wave 4 that terminates near the 100% retracement at $48.60 is textbook, not aberrant — and it sets up wave 5 with the correction fully worked off rather than hanging over the advance.
The Fundamental Backdrop
Silver’s supply picture continues to support the longer-term case even as near-term price action corrects. The World Silver Survey 2026 reports the market ran a 40.3Moz deficit in 2025 — the fifth consecutive year demand exceeded supply — and forecasts a sixth straight deficit in 2026, widening to 46.3Moz with mine production expected to stay roughly flat.
That said, the demand mix is shifting rather than simply strengthening, and it is worth stating plainly. Total demand is expected to fall 2% in 2026 with industrial fabrication down 3% to a four-year low, while coin and bar demand is forecast to rise 18% — the deficit widens despite softer demand because supply is shrinking too. A deficit driven by contracting supply is a different animal from one driven by accelerating demand, and it argues for volatility rather than a smooth advance. Traders can follow live SLV price action on Investing.com for real-time confirmation.
What to Watch This Week
The $52.42 – $53.58 Reaction
Whether the bullish gap and EMA(63) produce a bounce or give way determines the timing of everything below. A clean break through opens the liquidity pool quickly.
Behaviour at the Lows, Not Just the Level
If price reaches $49.61–$51.12, the reaction matters more than the touch. A sharp rejection with a close back above $51.72 would signal the sweep is complete and wave 5 is beginning. A sustained close below $48.60 would break the wave 4 count entirely and require a rethink.
Equilibrium as the Invalidation
A decisive reclaim of $56.96 and the bearish gap above it would mean the correction ended at the recent low and the sweep scenario is off the table.
SLV Summary
SLV at $54.69:
🔴 Bearish below $56.96 — targets the unswept liquidity at $51.12, then $49.61
⚠️ Neutral between $52.42 and $55.84 — corrective chop inside the range, no edge
🟢 Invalidated on a confirmed close above $56.96 and the $55.84–$56.95 gap — that ends the correction early
SLV is in discount with bearish bias, net bearish market structure, and two unswept lows sitting beneath an unmitigated order block. The near-term path points lower. But the SMA(200) is rising far below, the 100% retracement aligns with the wave 4 low, and the supply deficit enters its sixth year. The structure now rests on a single level: below $56.96 the sweep stays live, and that sweep is what sets up wave 5 rather than ending the trend.
Run any instrument through the ICT Scanner and Elliott Wave Scanner yourself — fair value gaps, order blocks, market structure and unswept liquidity, auto-detected in real time — with the PST All-Access plan, backed by a 30-day money back guarantee.
—
Disclaimer: This analysis is for educational purposes only and does not constitute financial advice. Trading involves significant risk. Always conduct your own research before making any investment decisions.