Fundamental overview
Gemini 3 AI Momentum — Google’s latest model outperforms or closely rivals ChatGPT in benchmarks, triggering a reported “Code Red” at OpenAI and fueling investor enthusiasm. Analysts highlight Gemini 3’s impact on Search, YouTube, and Cloud starting in 2026.
Is GOOGL overbought?
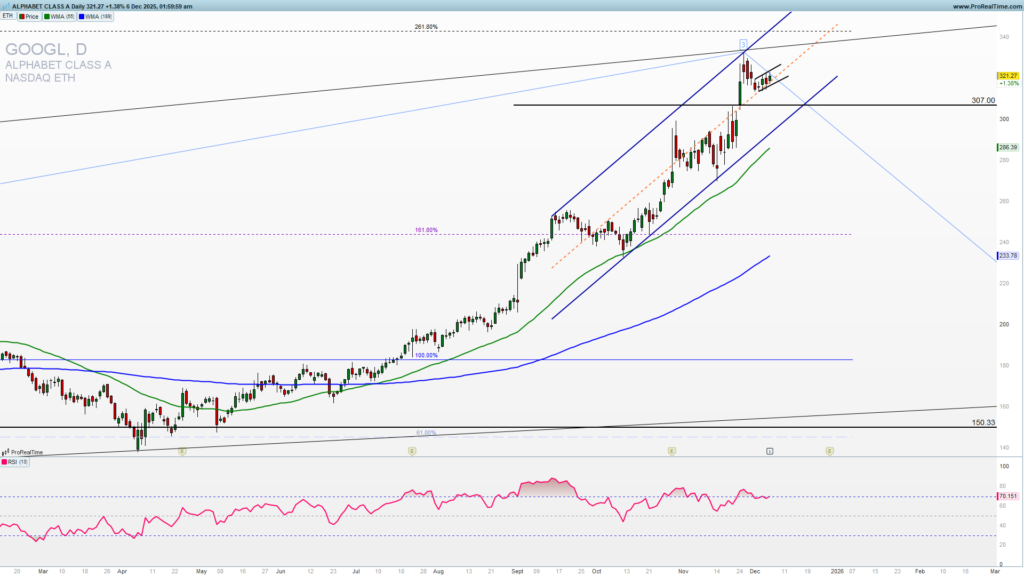
GOOGL formed a huge broadening wedge from 2020. GOOGL bounced from 150 cluster of the support and reached 332 high on November 24. It reversed from this level which is also the high of the broadening wedge and uptrend line resistance as you can see on the weekly chart. RSI is deeply in the overbought zone and recently is showing the signs of a negative divergence.
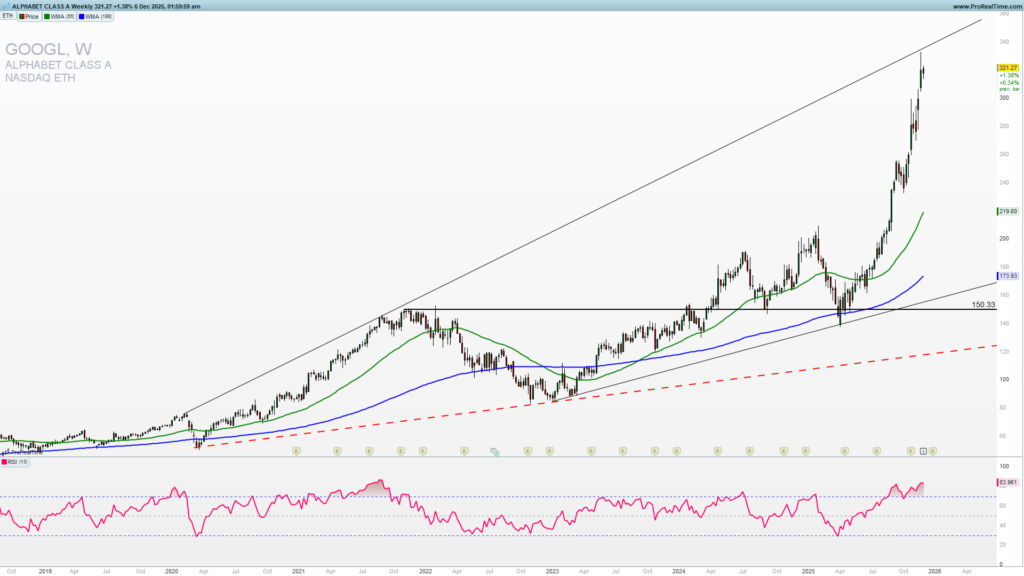
Stock reached 261.8% Fibonacci extension from the March, 2020 low building almost perfect three waves higher. The reversal lower from this high point would be considered as the fourth wave if happens. A break below 307 is required for the fourth wave pullback to be confirmed and a acceleration lower. I am aware that many traders will find this option impossible, and most of them will continue to look higher form this point. Evidence shows that no asset has a parabolic move. GOOGL is now 50% distant from the first moving average (33). It has never been so distant from moving averages in history. It is a reason to be cautious.
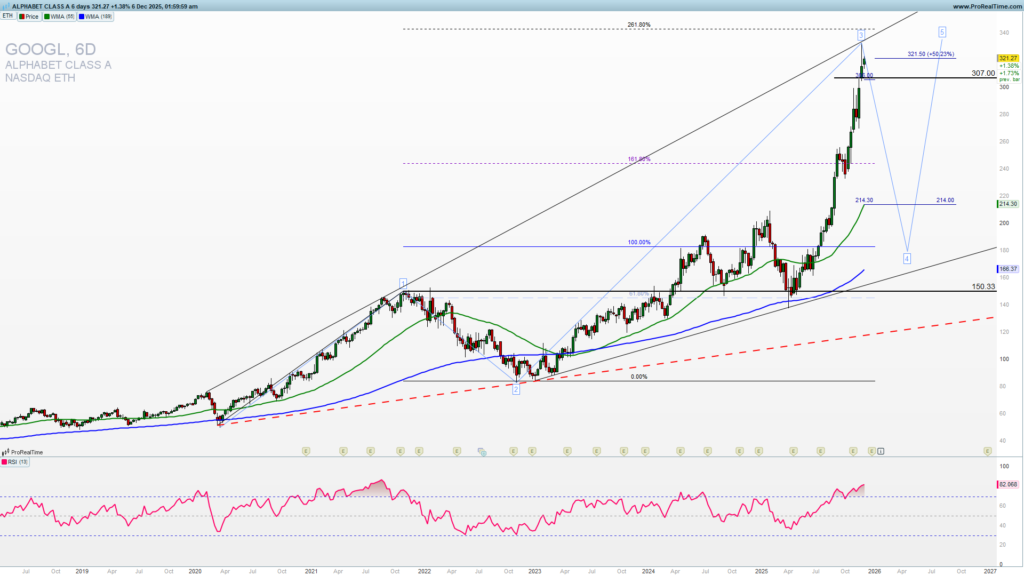
Last week it reached bearish flag (join to get premium analysis and everyday updates Cyber week up to 50% off) within a rising channel. If we get a break below 318 we could see a 307 level test and more important 295. Break below those levels will lead to a deeper pullback and a healthy correction lower.
Although a rip higher to 340 I am more inclined to short trade entries here or higher and buying put options, because being long from these levels is not offering a good risk to reward as we are near the medium-term high and a correction lower is much needed if GOOGL traders want to see higher levels in the future.