WTI crude oil has staged a powerful breakout in April 2026, surging more than 17% in a single week and closing above $97 per barrel. The catalyst is unmistakable — the continued closure of the Strait of Hormuz, escalating US-Iran tensions, and the breakdown of ceasefire negotiations have reignited the bull case for crude oil after weeks of corrective price action. I truly believe that we will not have a fast resolution of this conflict and that energy crisis will deepen even more.
For traders watching the energy markets closely, the technical and fundamental setup is now aligned for a potential extension toward $100 and beyond. My outlook on WTI is neutral to bullish, with key catalysts likely to determine direction over the coming weeks.
For broader market context, also read our Weekly Futures Market Overview and Gold XAU/USD Analysis.
Live WTI Crude Oil price — Investing.com
EIA Short-Term Energy Outlook
WTI Current Market Structure — A Powerful Technical Breakout
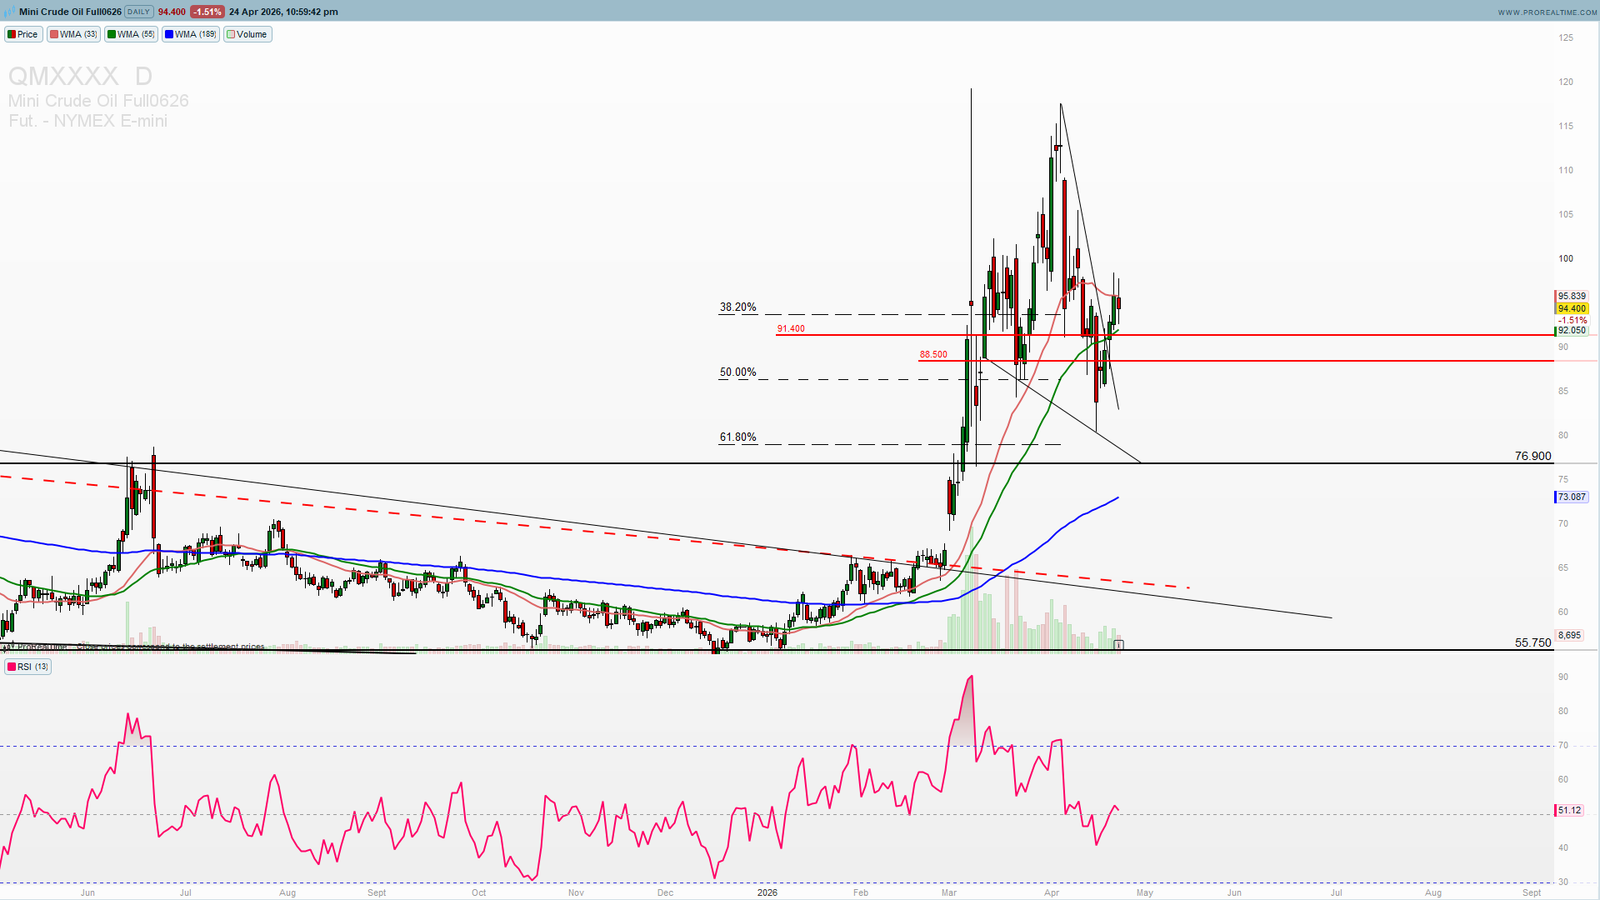
WTI crude oil has experienced one of its most volatile periods in years. From the April lows near $80 per barrel, WTI has rallied aggressively to break above the descending trend line that had capped gains since early April. The breakout came on strong momentum, with crude oil gaining over 4% on a single trading session before extending higher on geopolitical fears.
The price action is now constructive. After breaking above $93–$95 resistance, WTI has tested the broken trend line as new support and held — a classic bullish reversal signal. The move above the $97 level on rising volume confirms that buyers are firmly back in control of short-term price action.
The fundamental driver remains the same: the Strait of Hormuz blockade. Approximately 20% of global oil supply transits through this narrow waterway, and with the closure entering its second month, the supply disruption is now structurally tightening global crude markets.
Key Support and Resistance Levels
$103.46 — Major Resistance / Bull Trigger
This is the critical level for the next leg higher. A sustained break above $103.46 with conviction would open the door to the $110–$115 range, aligning with EIA forecasts of WTI peaking near $115 in Q2 2026.
$100 — Psychological Resistance
The round number $100 acts as both psychological and technical resistance. A clean break above $100 typically triggers algorithmic buying and momentum chasing — a key level for short-term traders.
$97 — Current Trading Range
WTI is currently consolidating around the $97 level after the recent breakout. This zone has acted as resistance multiple times and is now the key pivot for the next directional move.
$91.40— Swing High Reference
The previous wedge swing high serves as immediate support on any pullback. As long as WTI holds above this level, the bullish structure remains intact.
$88.50 — Key Support / Pivot
This is the most important near-term support level. A break below $88.50 would invalidate the immediate bullish setup and shift the structure back to neutral.
$85.85–$87.39 — Major Support Zone
The 38.2%–50% Fibonacci retracement levels combined with the broken trend line. A pullback to this zone would still be considered healthy within the bullish framework and would offer a high-probability long entry.
$79.00 — Critical Support Floor
The 61.8% Fibonacci level and the line in the sand for the bullish thesis. A break below $79.00 would signal a deeper correction and require reassessment of the outlook.
Macro Catalysts — The Iran Situation Drives Everything
Strait of Hormuz Closure
The continued closure of the Strait of Hormuz is the single most important catalyst for crude oil prices. Approximately 20 million barrels per day flow through this chokepoint in normal conditions. With the blockade now extending into its second month, the supply tightness is no longer transitory — it is becoming a structural feature of global energy markets.
US-Iran Negotiations Stalling
US-Iran peace talks have been extended indefinitely as Washington awaits a new formal proposal from Tehran. President Trump’s recent decisions — including ordering the US Navy to “shoot and kill” vessels laying mines in the strait, and the boarding of an Iranian supertanker in the Indian Ocean — have complicated diplomatic prospects significantly.
Iran Considering Pakistan Talks
Reports suggest Iranian Foreign Minister Abbas Araghchi may travel to Pakistan for a possible second round of peace talks. Any breakthrough would immediately reverse the bullish oil narrative and send prices sharply lower. Conversely, a breakdown in talks could push WTI toward $110+ in short order.
EIA Q2 Forecast — $115/Barrel Peak
The US Energy Information Administration’s April 2026 Short-Term Energy Outlook projects Brent crude to peak at $115 per barrel in Q2 2026 before easing as Strait of Hormuz flows resume. WTI typically trades $4–$8 below Brent, suggesting WTI peak targets in the $107–$111 range over the coming months.
OPEC+ Production Considerations
With supply tight and prices elevated, OPEC+ is monitoring whether to increase production. However, member countries have shown little appetite for raising output, preferring to capture higher prices while the supply disruption persists.
Technical Indicators — Bullish Setup Confirmed
RSI — Recovering from Oversold
The 14-day RSI on WTI is recovering from oversold conditions and has now turned higher, suggesting renewed buying momentum. Room remains for further upside before reaching overbought territory.
Moving Averages — Pivot Point
The 100-day and 200-day SMAs both sit above current price action and continue to slope downward — a sustained move back above these indicators would be needed to confirm a more meaningful trend reversal. The 50-day MA has now flattened, suggesting the downtrend pressure is exhausting itself.
Volume Confirmation
The breakout above $93–$95 was accompanied by rising volume, a critical confirmation signal. High volume on breakouts significantly increases the probability that the move continues.
Pivot Point — $93.07
The current technical pivot sits at $93.07. As long as WTI remains above this level, the bullish bias is favoured.
Trade Scenarios — Neutral to Bullish
Primary Bullish Scenario:
WTI holds above $93–$95 support and breaks above $100. Next targets: $103.46, then $110, with the EIA-projected peak around $115. Catalyst: continued Strait of Hormuz closure or escalation in US-Iran tensions.
Neutral Scenario:
WTI consolidates between $90 and $100 over the coming weeks as markets wait for clarity on US-Iran negotiations. Trading the range with defined risk would be the appropriate strategy.
Bearish Risk Scenario:
A breakthrough in US-Iran peace talks reopens the Strait of Hormuz. WTI breaks below $89.85 support and retraces toward $79.00 (61.8% Fib). This scenario requires diplomatic breakthrough.
Invalidation for Bull Case: Daily close below $88.50 with strong selling pressure.
WTI Price Targets for 2026
Based on our analysis combining technical structure, fundamentals and macro context:
Conservative target: $103.46 — major Fibonacci resistance and key technical level
Base case target: $110–$115 — aligns with EIA forecast peak in Q2 2026
Bull case target: $115+ — sustained Hormuz disruption with no diplomatic resolution
The base case remains a move toward the $110 zone over the coming weeks, driven by ongoing supply concerns and the absence of meaningful diplomatic progress.
Conclusion — Oil Bulls Have the Edge — for Now
WTI crude oil has reasserted its bullish structure after the April pullback. The breakout above $97 with strong volume, the continued Strait of Hormuz closure, and the breakdown of ceasefire negotiations have created a near-perfect setup for an extension toward $100 and beyond.
The single most important variable to watch is US-Iran diplomacy. Any meaningful breakthrough would reverse the bullish narrative quickly. Without one, supply constraints and risk premium will continue to support prices toward the EIA-projected $115 peak.
For traders, the strategy is clear: respect the $88.50 invalidation level, watch for confirmation of breakouts above $100 and $103.46, and maintain awareness that geopolitical headlines can move WTI by $5–$10 in a single session in either direction.
Want real-time WTI levels, Elliott Wave counts, and precise trade setups? Access ProSignalTrades Premium →
Get Tomorrow’s Setup Before the Market Opens
Daily signals · Live dashboards · Private Telegram · From €39/mo
🛡️ 30-Day Money Back Guarantee · Cancel Anytime
—
Disclaimer: This analysis is for educational purposes only and does not constitute financial advice. Trading involves significant risk. Always conduct your own research before making trading decisions.