Gold Gold (XAU/USD) is at a critical inflection point. After one of the most explosive multi-year rallies in modern history — with prices surging over 54% in the past year alone — the precious metal is now consolidating near $4,666, building energy for its next major move.
In this analysis, we break down the current market structure, identify the key price levels every gold trader needs to watch, and present our price target for the months ahead.
XAU/USD Current Market Structure
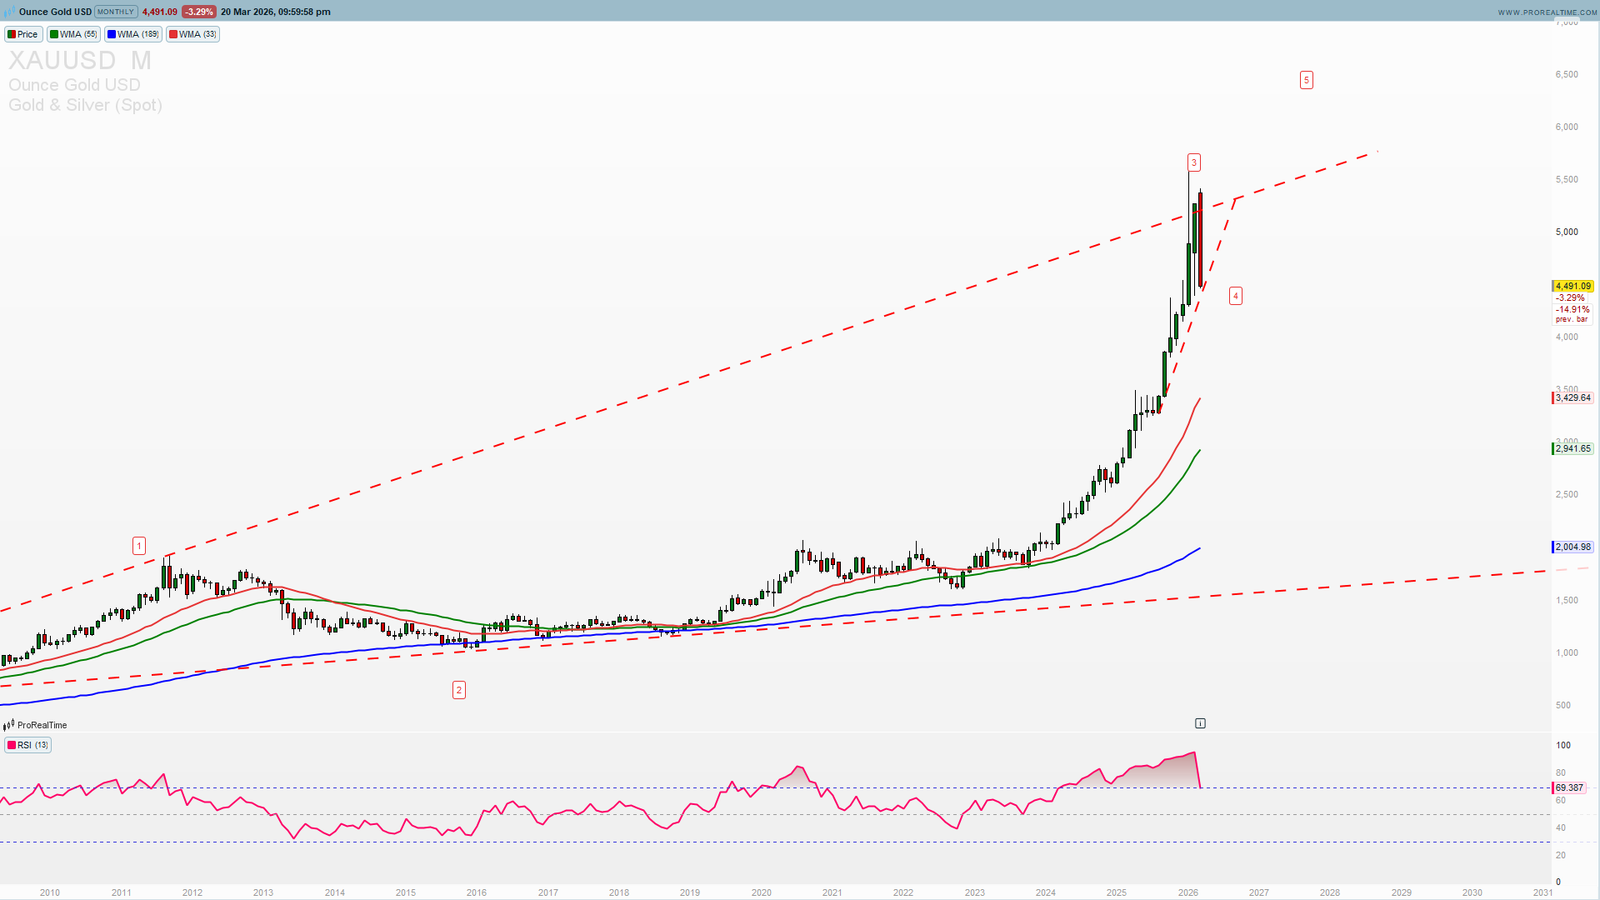
It has been in a dominant uptrend since 2022, posting a remarkable series of higher highs and higher lows. The price action in early 2026 has shifted from pure trend-following into a consolidation phase — a healthy development after such an extended rally.
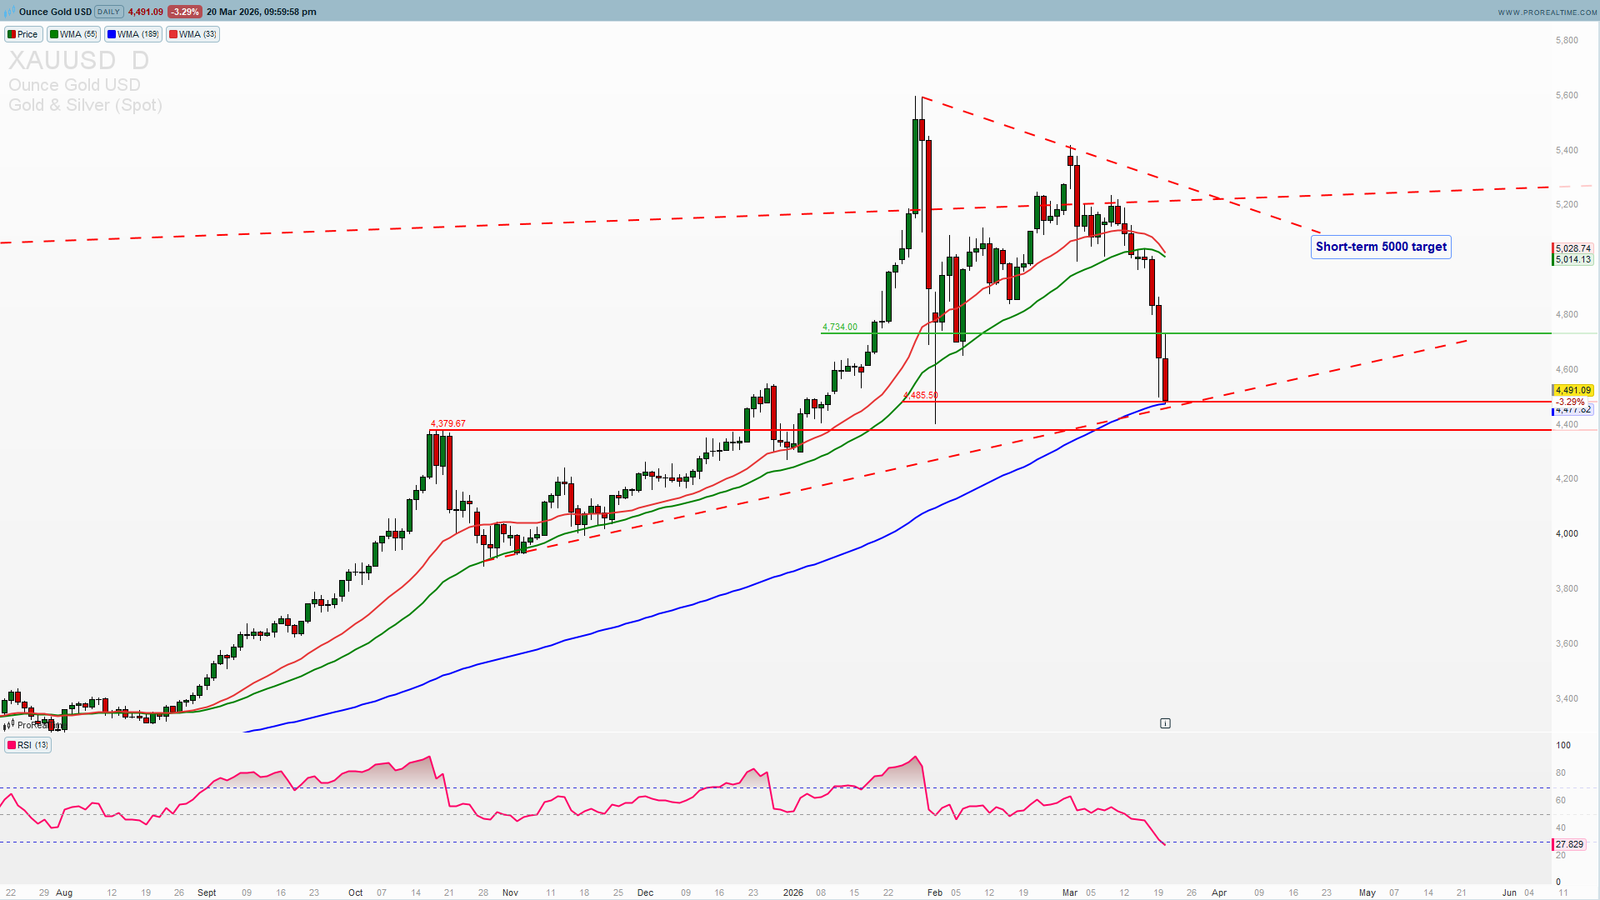
Gold is currently trading at $4,500 (XAU/USD) and is sitting in a defined range between $4,500 support and $5000 resistance. This type of tight consolidation after a strong rally is typically a continuation pattern — meaning the path of least resistance remains to the upside.
What makes the current setup compelling is the macro backdrop. Central bank demand remains robust, geopolitical uncertainty continues to drive safe-haven flows, and the Federal Reserve’s rate path remains a key tailwind for non-yielding assets like gold.
Key Support and Resistance Levels
Understanding where gold finds buyers and sellers is essential for timing entries and managing risk. Here are the critical levels we’re watching:
$4,500 — Key Support Zone
This is the most important level on the chart right now. The $4,500 area has acted as a demand zone, attracting buyers on multiple tests. As long as gold holds above this level, the bullish structure remains intact. A decisive close below $4,500 would signal that a deeper pullback is underway and would change my short-term bias.
$4,500 — Current Price / Pivot
Price is currently consolidating around this level. The way gold reacts here in the coming sessions will determine the next directional move.
$4,730 — Immediate Resistance
This is the current ceiling. A breakout and daily close above $4,730 would be a strong bullish signal, opening the door for a quick test of the next psychological levels above. Watch for volume confirmation on any breakout attempt.
$5,000 — Major Target / ATH Extension
The $5,000 level is both a psychological milestone and my primary price target for this bullish cycle. Round numbers in gold markets attract significant attention from institutional traders, and a move to $5,000 would represent a natural extension of the current uptrend structure.
Elliott Wave Analysis — Where Is Gold in the Cycle?
From an Elliott Wave perspective, the current consolidation near $4,500 appears to be a fourth wave correction within a larger impulse sequence. If this count is correct, we should expect:
– Wave 4 to hold above the $4,500 support zone
– A fifth wave extension targeting the $5,500 area and potentially beyond
– The overall bullish structure remains valid as long as $4,500 is defended
The risk scenario: A break below $4,500 with a strong follow-through selling could indicate that wave 4 is extending into a more complex correction, potentially retesting lower support zones before the next leg higher.
Macro Drivers Supporting Gold in 2026
Gold’s technical setup doesn’t exist in a vacuum. Several fundamental factors are aligning to support continued upside:
Central Bank Buying: Global central banks have been consistent buyers of gold, thereby reducing reliance on U.S. dollar reserves. According to the World Gold Council, central bank buying remains at historically elevated levels. This structural demand provides a floor under prices.
Geopolitical Risk Premium: Elevated geopolitical tensions globally continue to support safe-haven demand. Bullion typically benefits during periods of uncertainty.
Federal Reserve Policy: Market expectations around Fed rate cuts remain a key variable. Any pivot toward more accommodative policy would be a significant tailwind for XAUUSD. This is now in question due to high energy prices, which may be short-lived.
USD Weakness: A softer US dollar environment generally supports higher metals prices, as the metal becomes cheaper for international buyers.
Trade Setup & Scenarios
Based on current price action, data-driven analysis, and my Elliott Wave count, here is how we’re approaching gold:
Bullish Scenario (Primary):
– Gold holds above $4,600 support
– Price breaks and closes above $4,730 resistance
– Target: $5,000 and potentially higher
– This remains our primary scenario given the intact uptrend structure
Bearish / Risk Scenario:
– Break below $4,500 with high volume
– Potential pullback toward the $4,381–$4,400 area
– This would be a buying opportunity in the larger context, not a trend reversal
Invalidation: A sustained close below $4,200 would force a reassessment of the bullish thesis.
Gold Price Target 2026: $6,500
My primary price target for gold in 2026 remains $6,500. This level aligns with:
– Elliott Wave fifth wave projection
– Major psychological resistance
– Natural extension of the multi-year bull market
The key question is not if it reaches $5,000, but when and from what price structure. The current consolidation between $4,500 and $4,730 is building the foundation for that next leg.
Conclusion
Precious metal is holding a bullish structure above key support at $4,500, with immediate resistance at $4,730. The technical and fundamental backdrop remains constructive for a move toward my $5,000 target in the short-term.
The trade is simple: respect the $4,500 support, watch for a breakout above $4,730, and position for the next leg of this historic bull market.
Want data-driven, real-time gold levels and trade setups delivered directly to your dashboard? Access ProSignalTrades Premium →
Get Tomorrow’s Setup Before the Market Opens
Daily signals · Live dashboards · Private Telegram · From €39/mo
🛡️ 30-Day Money Back Guarantee · Cancel Anytime
—
Disclaimer: This analysis is for educational purposes only and does not constitute financial advice. Trading involves significant risk of loss. Always conduct your own research before making any trading decisions.
Trade safe!