The Dow Jones Industrial Average reached its all-time high of 50,516 in February 2026 and has since struggled to hold those levels. Despite the S&P 500 and Nasdaq 100 making new all-time highs in recent sessions, the DJIA is trading around 49,499 — underperforming its major index peers and sending a troubling technical signal that experienced traders should not ignore.
This divergence between the Dow Jones and the broader market is not random. It reflects the structural composition of the DJIA and raises serious questions about the sustainability of the current rally. Our outlook on the DJIA is bearish — and in this analysis we explain exactly why.
For broader market context, also read our NAS100 Futures Analysis and Weekly Futures Market Overview.
Live DJIA price — Investing.com
DJIA Index — S&P Dow Jones Indices
DJIA Current Market Structure — Warning Signs at All-Time High
The DJIA’s price action since the February 2026 all-time high has been structurally concerning. While the Nasdaq 100 has made multiple new all-time highs driven by mega-cap technology earnings, the Dow has failed to follow — a classic non-confirmation signal that has historically preceded meaningful corrections.
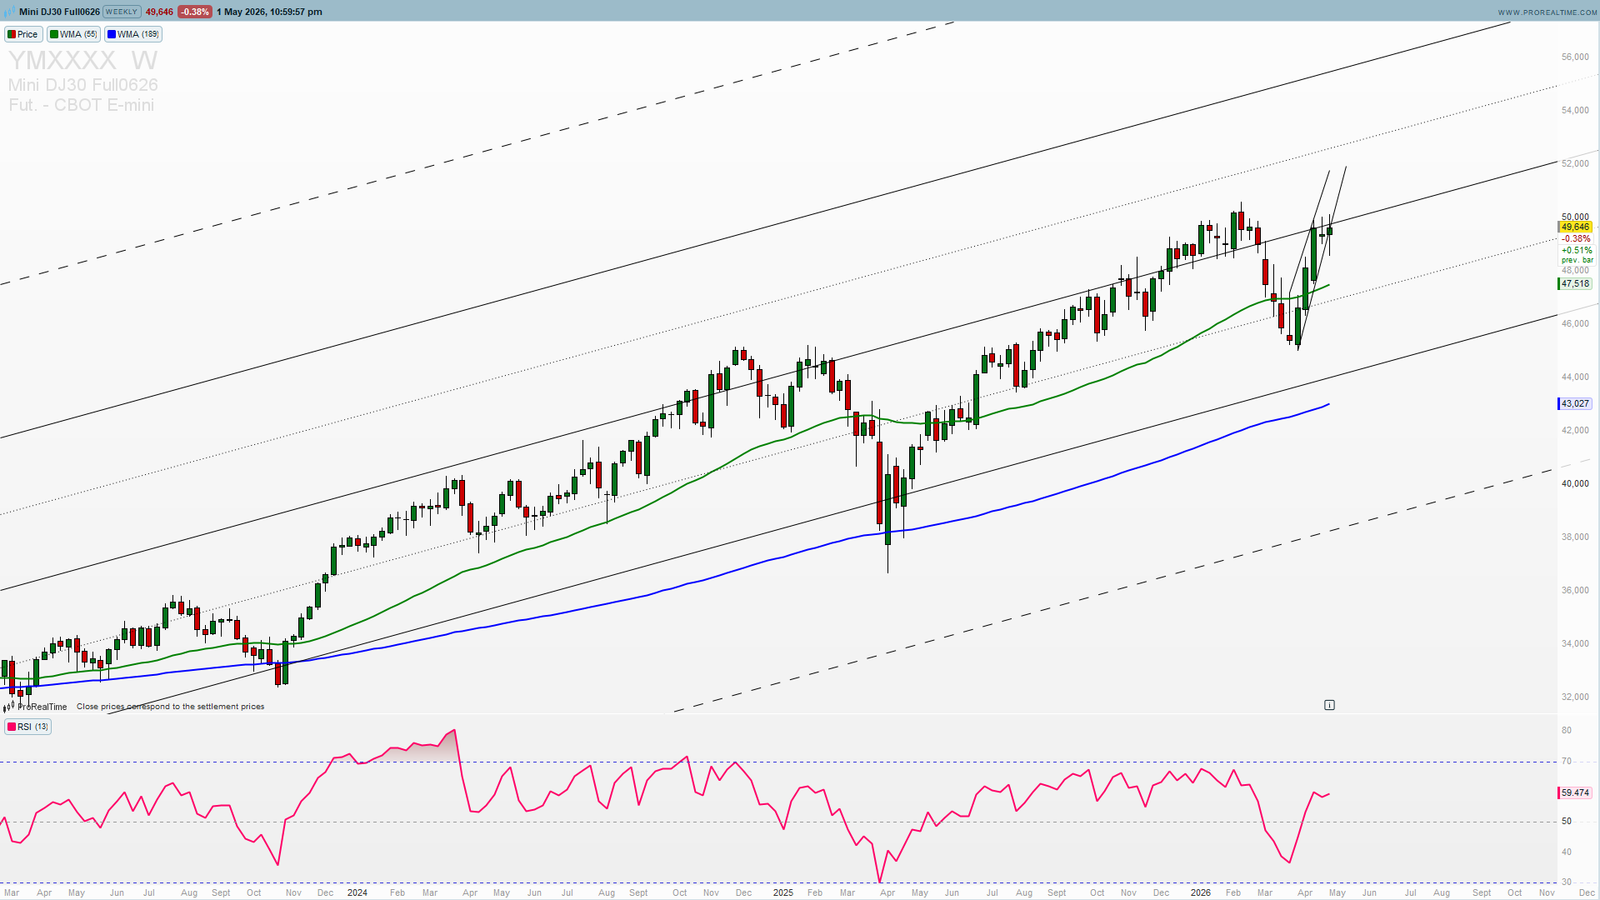
The weekly chart shows a textbook Rising Wedge pattern forming since the April 2025 lows. Rising wedges are bearish reversal formations — they occur when price rises within a narrowing range of higher highs and higher lows, indicating that buying pressure is weakening with each successive rally. When the lower support line of the wedge breaks, the decline is typically sharp and swift.
The DJIA is a price-weighted index of just 30 stocks — which makes it particularly sensitive to weakness in heavy hitters like UnitedHealth Group, Goldman Sachs and Visa. Recent underperformance from defensive heavyweights including Amgen, 3M and McDonald’s has weighed on the index even as tech giants like Apple and Salesforce have provided support.
The Non-Confirmation Warning
The most critical bearish signal in the current environment is the non-confirmation between the DJIA and the Nasdaq 100.
When the Nasdaq 100 and S&P 500 make new all-time highs while the Dow Jones fails to follow, Dow Theory defines this as a non-confirmation — a warning that the bull market may be losing breadth and that the current rally is concentrated in a narrow group of stocks rather than being a broad-based advance.
The current situation is precisely this scenario. Technology and AI-driven mega-caps are carrying the Nasdaq to new highs, while the Dow’s industrial and defensive components are lagging significantly. This is a historically reliable warning signal — and traders should treat it as such.
Key Support and Resistance Levels
50,516 — All-Time High / Major Resistance
The February 2026 all-time high. Multiple failed attempts to reclaim and sustain above this level would confirm the bearish case.
49,500–50,000 — Current Trading Range
DJIA is consolidating in this zone. A failure to break higher from here — particularly if the Nasdaq continues making new highs while the Dow stalls — would strengthen the non-confirmation warning.
48,760 — Near-Term Support
First meaningful support below current levels. A break here would signal the beginning of a more significant correction.
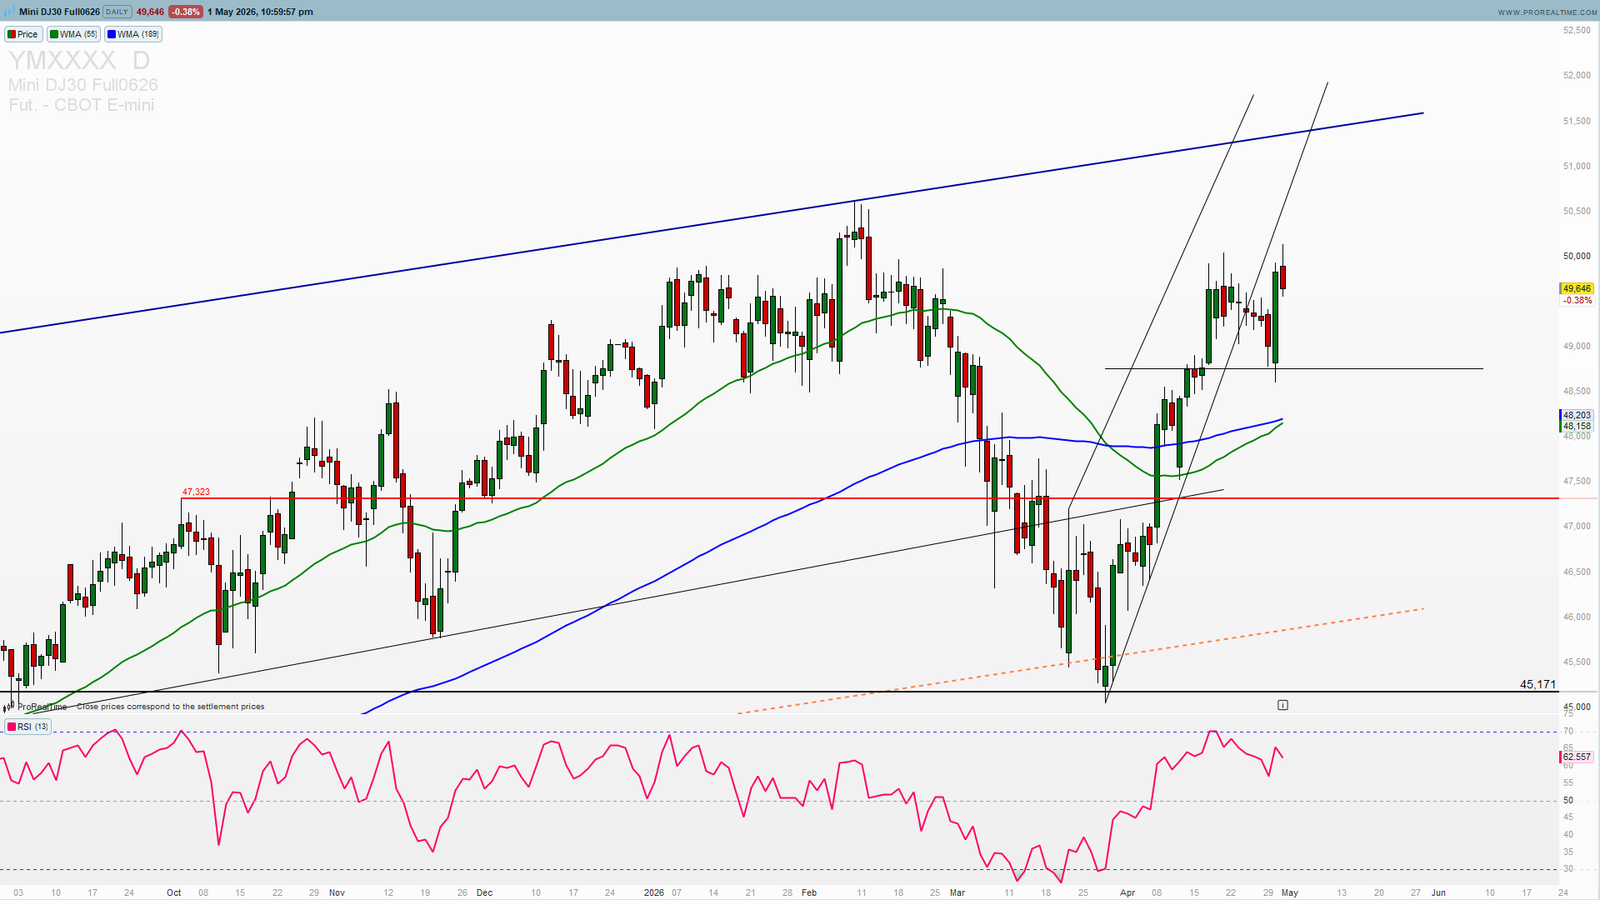
47,000–47,500 — Key Support Zone
This zone aligns with the previous consolidation area from early 2026 and the 50-day moving average. A test of this level should be expected in the bearish scenario.
45,500–46,000 — Major Support
The 38.2% Fibonacci retracement of the rally from the April 2025 low to the February 2026 all-time high. A move to this zone would represent an approximately 10% correction from ATH — well within the range of normal bull market corrections.
43,000–44,000 — Deep Support / Rising Wedge Target
In the event the Rising Wedge breaks down with conviction, the measured move target points toward the 43,000–44,000 zone. This level would represent the 50% Fibonacci retracement and a more significant correction.
Invalidation: A weekly close above 51,000 with strong breadth would invalidate the bearish case.
The Components Driving the Divergence
Understanding why the Dow is underperforming requires looking at its composition:
Lagging components weighing on DJIA:
Amgen fell 4.74% on May 1, 2026 — the largest drag on the index. 3M declined 2.74%. McDonald’s fell 2.37%. These defensive heavyweights are under pressure as rising oil prices (WTI above $100) squeeze margins and consumer spending shows signs of softening.
Supporting components:
Salesforce surged 4.13% on strong AI-driven revenue. Apple gained 3.26% after beating earnings. Merck added 2.73%. But these gains were insufficient to offset the broader weakness across the index’s industrial and defensive components.
The structural problem:
The DJIA is a price-weighted index — meaning a stock’s absolute price, not its market capitalisation, determines its weight. This creates distortions. Goldman Sachs, despite a market cap of only $167 billion, has outsized influence because of its high share price. Meanwhile, Apple — with a $3.3 trillion market cap — has less weight in the Dow than in the S&P 500 or Nasdaq. This structural quirk means the Dow often diverges from the broader market when tech leads and industrials lag — exactly the current situation.
Macro Headwinds for the DJIA
WTI Oil Above $100
With WTI crude oil trading above $100 per barrel and the Strait of Hormuz disruption ongoing, energy costs are squeezing margins across the Dow’s industrial and consumer components. Airlines, logistics companies and consumer discretionary names all face margin pressure at these oil price levels.
Federal Reserve — No Rate Cuts in Sight
The Fed held rates steady at its April 29 meeting and signalled no cuts for 2026 as inflation remains elevated. Higher-for-longer rates are a headwind for the Dow’s financial and real estate components and create pressure on consumer spending — which directly impacts retail and consumer staples names within the index.
Q1 GDP and Consumer Spending
AI investment carried the US GDP in Q1 2026 — offsetting signs of slowing private consumption. This is a concerning development for the Dow, which has greater exposure to consumer-facing companies than the Nasdaq.
Iran-US Ceasefire Progress
Iran submitted a new agreement proposal in early May, raising hopes for a Strait of Hormuz resolution. If successful, oil prices would drop sharply — which would be positive for consumer and industrial names within the Dow and potentially trigger a DJIA outperformance. This is the primary upside risk to the bearish case.
Trade Scenarios — Bearish Outlook
Primary Bearish Scenario:
DJIA fails to reclaim 50,516 ATH while Nasdaq continues to outperform. Rising Wedge breaks down. Targets: 47,000–47,500 initially, then 45,500–46,000 (38.2% Fib). Catalyst: continued oil pressure, consumer spending slowdown or a negative macro surprise.
Neutral Scenario:
DJIA consolidates between 48,500 and 50,500 for several weeks as markets digest earnings and await Iran deal clarity. No new highs, no major breakdown.
Bullish Risk Scenario:
Iran-US ceasefire confirmed and Strait of Hormuz fully reopens → oil drops sharply → Dow industrials and consumer names rally → DJIA breaks above 51,000 and makes new all-time high. This would invalidate the bearish case entirely.
DJIA vs Nasdaq — The Non-Confirmation That Should Concern Every Trader
The current setup in the DJIA is one of the most important technical divergences in the market right now. While the headline numbers suggest a healthy bull market — with the S&P 500 and Nasdaq at all-time highs — the Dow’s underperformance is telling a different story beneath the surface.
Breadth is narrowing. Leadership is concentrated in AI and technology mega-caps. The industrial and defensive backbone of the American economy — as represented by the DJIA — is struggling.
History suggests this divergence eventually resolves in one of two ways: the Dow catches up to the Nasdaq, or the Nasdaq corrects down to the Dow. Given the macro headwinds outlined in this analysis — elevated oil prices, no Fed rate cuts, slowing consumer spending — we lean toward the latter.
Watch 49,500 as the near-term pivot. A sustained break below 48,500 would be the first concrete signal that the correction has begun.
Want real-time DJIA levels, Elliott Wave counts, and precise trade setups? Access ProSignalTrades Premium →
Get Tomorrow’s Setup Before the Market Opens
Daily signals · Live dashboards · Private Telegram · From €39/mo
🛡️ 30-Day Money Back Guarantee · Cancel Anytime
—
Disclaimer: This analysis is for educational purposes only and does not constitute financial advice. Trading involves significant risk. Always conduct your own research before making trading decisions.