If you’ve ever looked at a price chart and wondered why markets don’t just go straight up or straight down — the answer lies in Elliott Wave Theory. Markets move in waves, alternating between impulsive moves (with the trend) and corrective moves (against the trend). One of the most powerful and recognizable corrective patterns is the ABC Correction — and Silver (XAG/USD) in 2026 is giving traders a textbook example in real time.
In this guide, we’ll explain exactly what an ABC correction is, how to identify it, and how you can use it to anticipate the next major move in any market. If you’re interested in Gold’s Elliott Wave structure, check out our Gold XAU/USD Price Analysis as well.
For live Silver price data, visit Investing.com XAG/USD. To learn more about Elliott Wave Theory, visit the Elliott Wave International website.
What Is an ABC Correction?
An ABC correction is a three-wave counter-trend move that occurs after a completed impulsive wave. In Elliott Wave Theory, markets alternate between two types of movement:
Impulsive waves (1-2-3-4-5) — move in the direction of the main trend, typically composed of five sub-waves.
Corrective waves (A-B-C) — move against the main trend, typically composed of three sub-waves.
This correction consists of:
Wave A — The first leg down (in a bullish market). Many traders mistake this for a normal pullback and try to buy the dip. This is usually a mistake because Wave A is just the beginning of the correction.
Wave B — A counter-rally that retraces part of Wave A. This is the most dangerous wave for traders because it looks like the uptrend has resumed. Many retail traders get trapped buying at the top of Wave B, only to get caught in the brutal Wave C decline.
Wave C — The final and most aggressive leg of the correction. Wave C typically equals or exceeds the length of Wave A, and it completes the corrective structure before the main trend resumes.
The key insight: after the correction completes, the main trend typically resumes with a powerful impulsive move.
The Three Rules of ABC Corrections
Before applying ABC analysis to any chart, remember these essential rules:
Rule 1: Wave B cannot exceed the origin of Wave A.
In a bearish correction within a bull market, Wave B cannot exceed the high from which Wave A started. If it does, the structure is not an ABC correction.
Rule 2: Wave C almost always makes a new low below Wave A.
This is what traps late buyers — they see Wave A end and assume the correction is over, but Wave C will typically push below the Wave A low.
Rule 3: Wave C tends to equal Wave A in length (100% extension).
This is the most useful Fibonacci relationship in these corrections. Measuring Wave A’s length and projecting it from the top of Wave B gives you a high-probability target for Wave C.
Silver XAG/USD in 2026 — A Textbook ABC Correction
Now let’s apply this theory to a real, current example that every trader should be watching: Silver (XAG/USD) in 2026.
The Setup — Silver’s Historic Bull Run
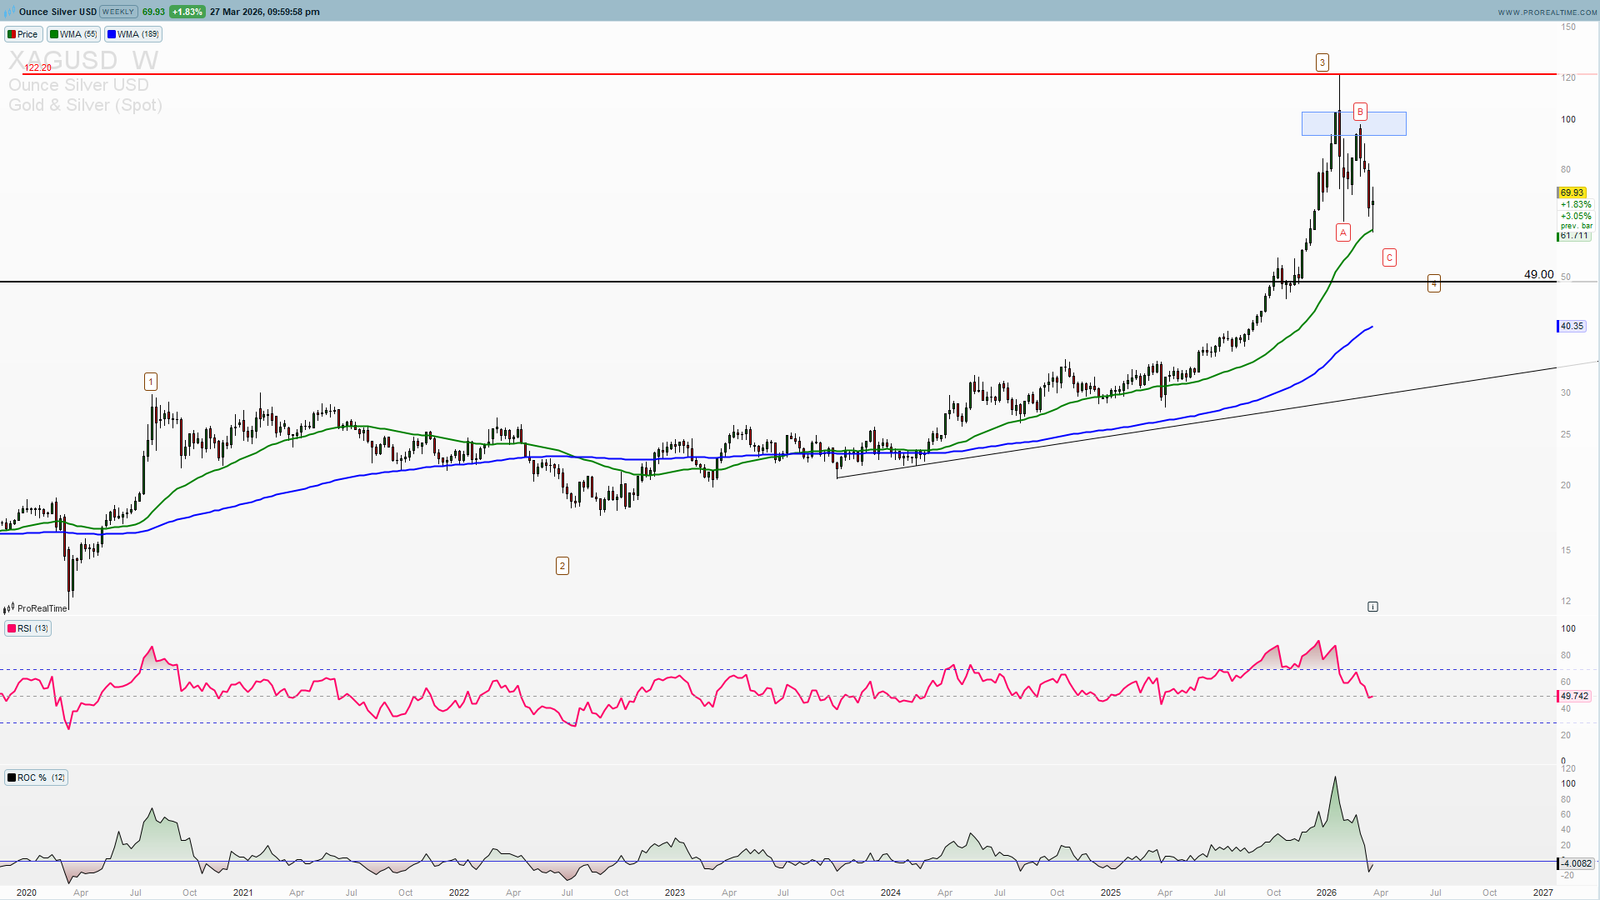
Silver had one of the most powerful bull runs in its history in 2025 and early 2026, driven by a combination of industrial demand (solar panels, AI hardware, electric vehicles), geopolitical safe-haven flows, and a weaker US dollar. The rally took Silver from around $28 in early 2025 all the way to an all-time high of $121.64 in January 2026 — a gain of over 330% in roughly 12 months.
This was a classic impulsive five-wave Elliott Wave structure at its finest.
Wave A — The First Leg Down ($121 → ~$62)
After reaching the all-time high, Silver began its corrective phase. The first leg down — Wave A — was sharp and aggressive, dropping from $121.64 to the $62–$63 support zone. This was a decline of nearly 50% from the peak. Many traders saw this as an overreaction and tried to buy Silver on the way down, expecting a quick recovery to new highs.
This is the classic Wave A trap.
Wave B — The Counter-Rally ($62 → ~$86)
After the Wave A decline, Silver staged a meaningful counter-rally — Wave B — bouncing from around $62 back up toward $85–$86. This recovery looked convincing to many traders. Headlines were calling for a Silver comeback. Social media was full of bullish Silver commentary.
But this was Wave B — a corrective rally within the larger corrective structure, not a new impulse up.
The key warning sign: Wave B failed to make a new high above $121.64 and showed weakening momentum compared to the initial rally. This is typical Wave B behavior.
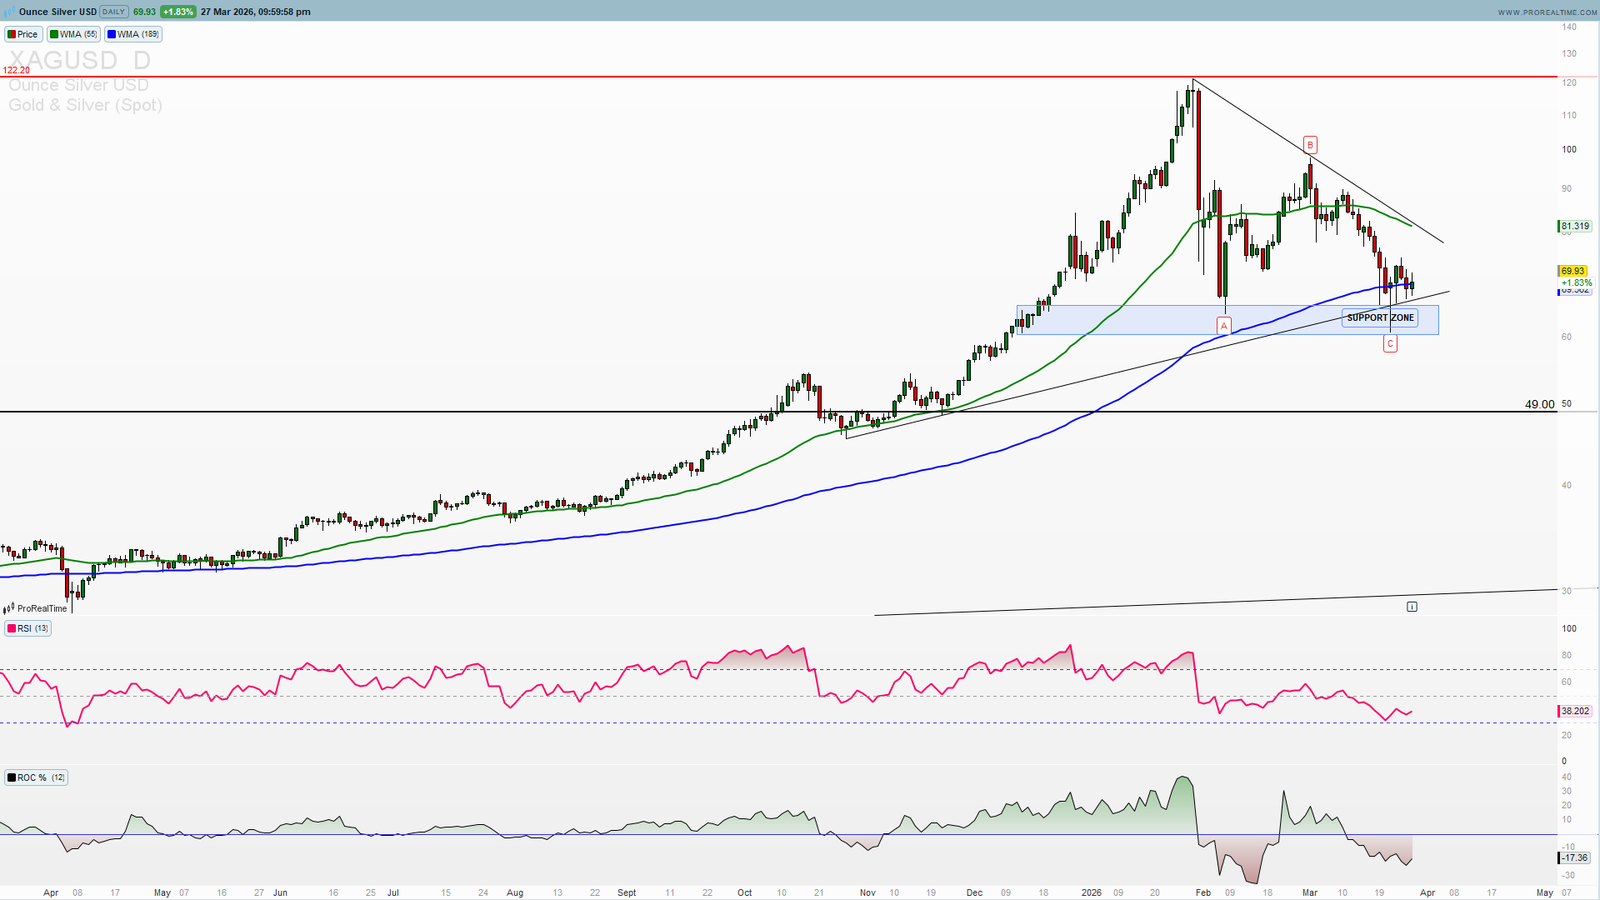
Wave C — The Final Flush ($86 → $68 and potentially lower)
Wave C has now begun in earnest. Silver has already dropped from the Wave B high near $86 back down to around $68 at the time of writing — a decline of over 20% from the Wave B peak. The move has been aggressive and impulsive, exactly as Wave C should be.
Using the Wave A = Wave C projection (measuring the length of Wave A and projecting it from the Wave B high), the technical target for Wave C completion falls in the $62–$66 zone — which also happens to be a major structural support area and Fibonacci confluence zone.
Key Price Levels to Watch
Based on the Elliott Wave ABC structure and technical analysis:
Current price: ~$68 (March 2026)
Wave C target zone: $62–$66 — this is where the ABC correction is most likely to complete, based on Wave A = Wave C projection and structural support.
Key support at $70: Psychological round number that Silver has tested multiple times. A sustained break below $70 opens the door to the $62–$66 target zone.
Invalidation: A daily close back above $86 (Wave B high) would invalidate the ABC count and suggest a new impulsive wave higher has already begun.
What Happens After the ABC Correction Completes?
This is the most important question for traders — because the entire value of identifying an ABC correction is knowing what comes next.
After a completed correction in a bull market context, Elliott Wave Theory advise the resumption of the main trend. In Silver’s case, this means a potential new impulsive wave higher could begin from the $62–$66 support zone, with targets eventually back toward and beyond the $121 all-time high.
The long-term fundamental case for Silver remains intact: ongoing supply deficits, surging industrial demand from solar energy and AI hardware, and central bank diversification all support higher Silver prices over a multi-year horizon.
The ABC correction is not the end of Silver’s bull market — it is potentially the last opportunity to buy Silver at a significant discount before the next leg of the bull market begins.
How to Trade it?
Here is how professional traders approach this corrections:
Step 1 — Do not fight Wave C. Once you identify that Wave C has begun, do not try to pick the bottom too early. Wave C moves are aggressive and can go further than expected.
Step 2 — Wait for the Wave A = Wave C level. Calculate your target zone using Fibonacci projections. For Silver, this is $62–$66.
Step 3 — Look for reversal confirmation. Do not buy blindly into a support zone. Wait for confirmation signals — a bullish engulfing candle, RSI divergence, or a break of the short-term downtrend structure which can be happening now.
Step 4 — Define your risk clearly. Place your stop loss below the ABC correction low. If Silver breaks below $60 with conviction, the Elliott Wave count needs to be reassessed.
Step 5 — Target the resumption of the main trend. If the ABC correction completes as expected, the next impulsive wave could target $85, $100, and eventually new all-time highs above $121.
Conclusion — Silver’s ABC Correction could be a Masterclass in Elliott Wave
The Silver XAG/USD price action in 2026 is providing traders with a rare opportunity: a textbook ABC correction unfolding in real time on one of the world’s most closely watched precious metals.
Understanding this corrective structure allows you to avoid the most common trading mistakes — buying Wave A, getting trapped at the top of Wave B, and panic selling at the bottom of Wave C. Instead, armed with Elliott Wave knowledge, you can identify the completion zone of the correction and position yourself for the resumption of the main trend.
Watch the $62–$66 zone carefully in the coming weeks. That is where the next major Silver trade setup may emerge.
Want real-time Silver levels, Elliott Wave counts, and precise trade setups? Access ProSignalTrades Premium →
Get Tomorrow’s Setup Before the Market Opens
Daily signals · Live dashboards · Private Telegram · From €39/mo
🛡️ 30-Day Money Back Guarantee · Cancel Anytime
—
Disclaimer: This analysis is for educational purposes only and does not constitute financial advice. Trading involves significant risk. Always conduct your own research before making trading decisions.