The SPDR S&P 500 ETF Trust (SPY) closed at $737.62 on May 8, 2026 — a new all-time high — as the S&P 500 flirted with the 7,400 milestone for the first time in its history. The rally has been driven by a powerful combination of factors: a blowout Q1 earnings season led by the Magnificent Seven, a resolution of the Iran-US ceasefire and the reopening of the Strait of Hormuz, and falling oil prices that have eased inflation concerns and revived expectations for Federal Reserve rate cuts.
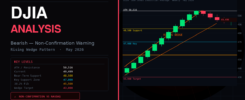
But with RSI at 76, Elliott Wave suggesting Wave 5 is nearing completion, and the Dow Jones still underperforming in a classic non-confirmation signal — the question every serious trader must ask is: is this rally built to last, or is a dangerous reversal setting up at all-time highs?
Live SPY price — Investing.com
S&P 500 Index — S&P Global
For broader market context, also read our DJIA Bearish Analysis and NAS100 Futures Analysis.
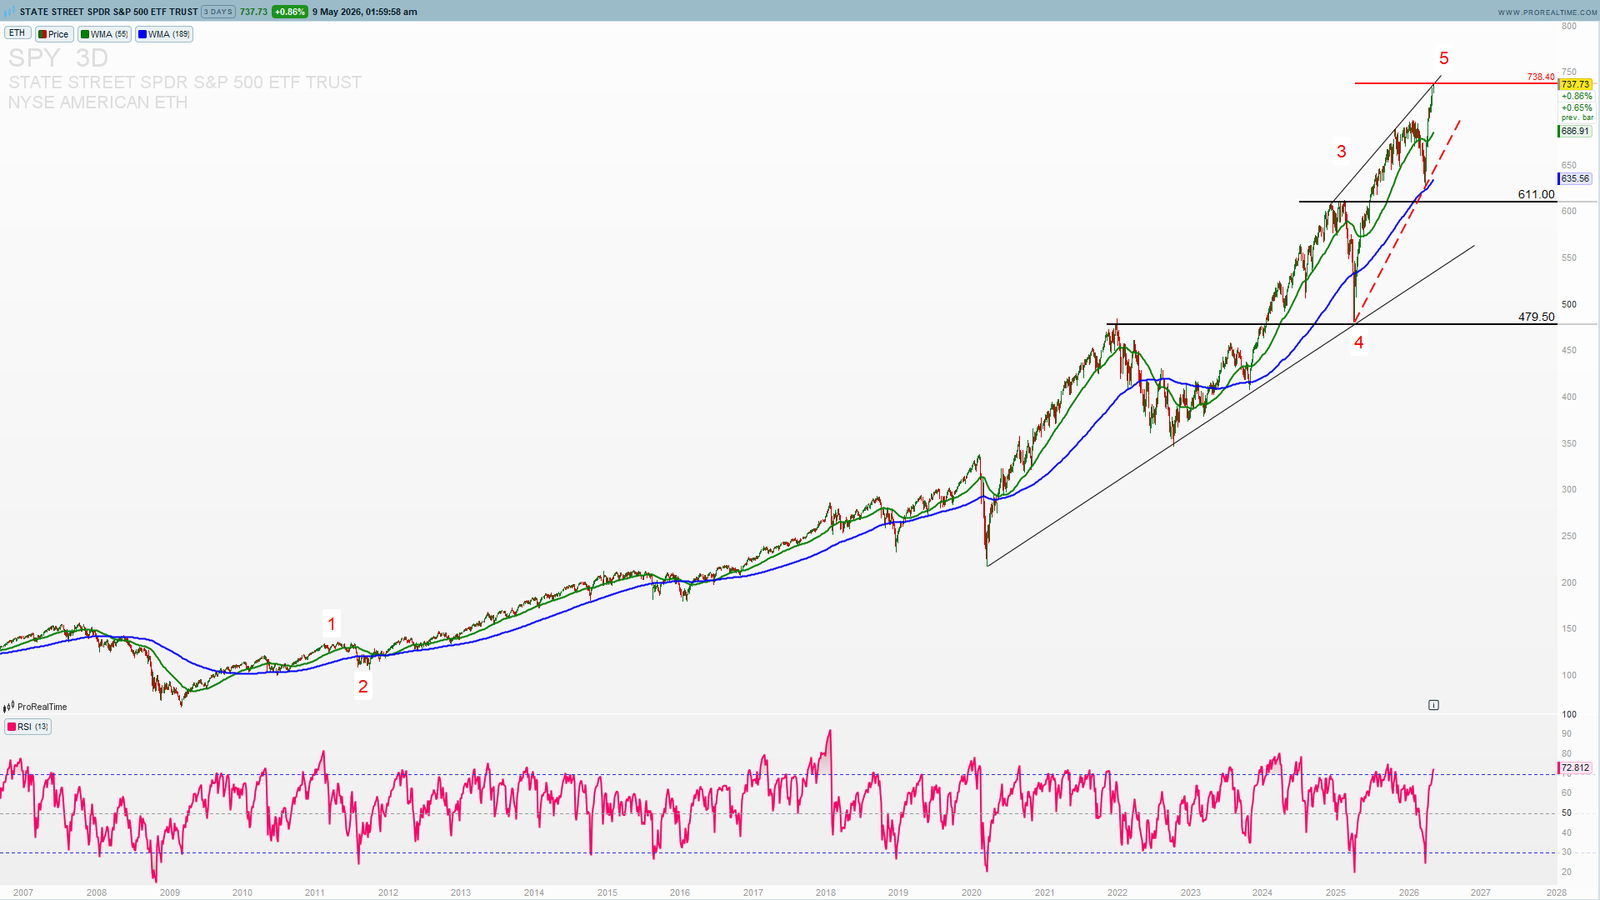
SPY Current Market Structure — A Five-Wave Impulse Nearing Completion
The Elliott Wave structure of SPY since the March 2026 low is textbook. From the correction low at approximately $630, the ETF has staged a five-wave impulse rally:
Wave 1: $630 → $658.52 — the initial recovery from the March lows
Wave 2: $658.52 → $644.16 — a normal corrective pullback, setting up the powerful Wave 3
Wave 3: $644.16 → ~$720 — the most extended and powerful wave, driven by Iran ceasefire and earnings beats from Microsoft, Meta, Alphabet and Amazon
Wave 4: Brief consolidation in the $700–$710 zone
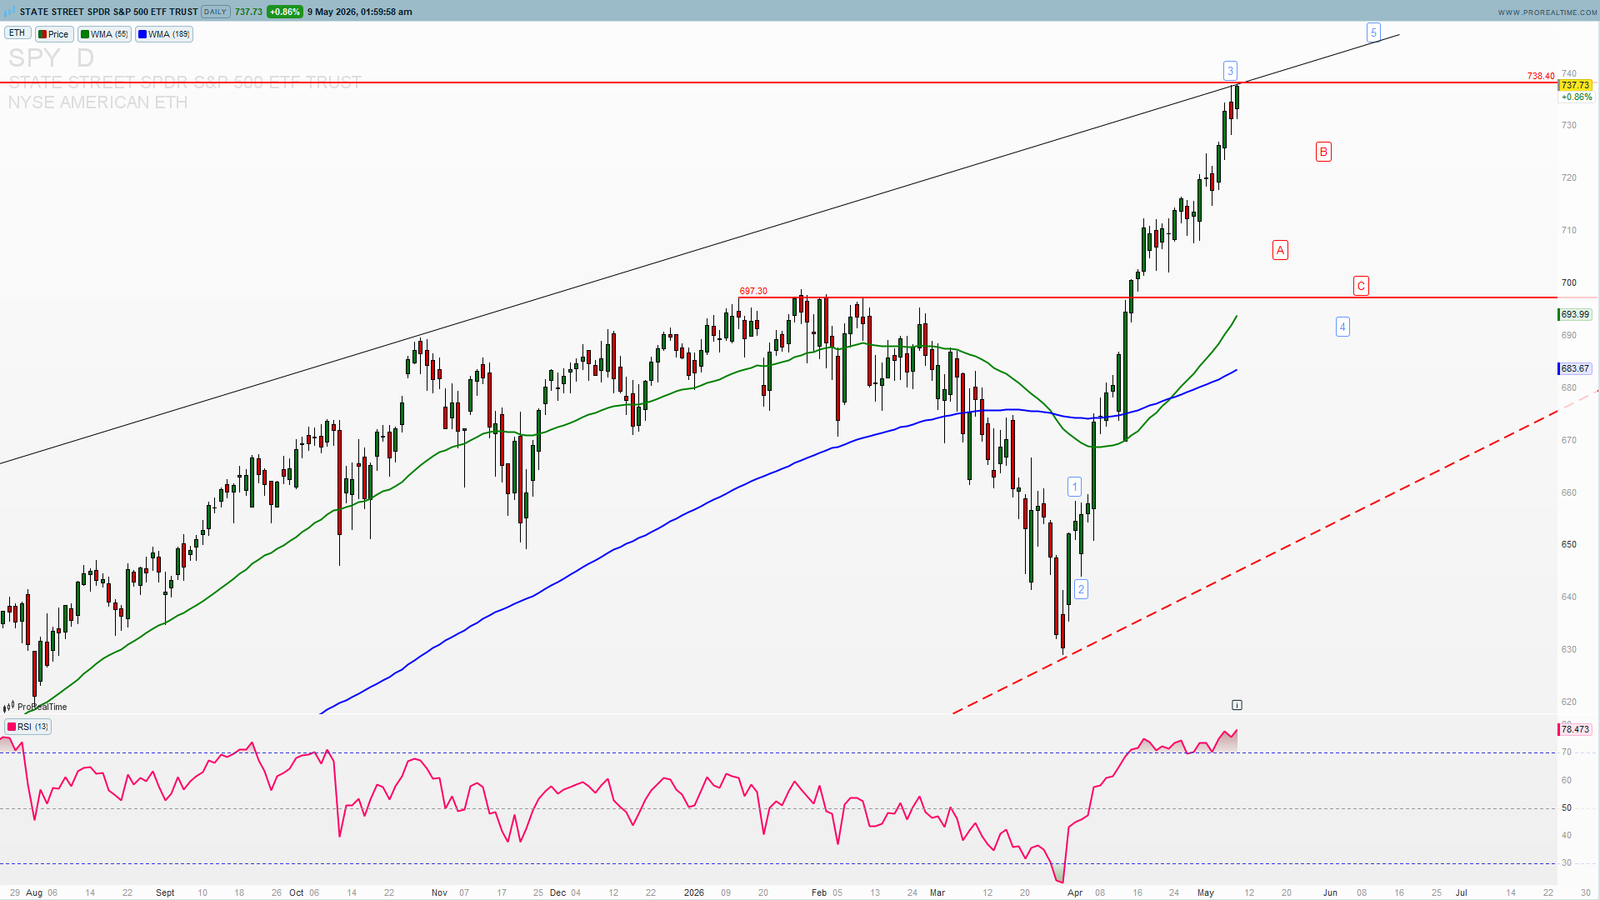
Wave 5: $710 → $737–$738 (current) — the final wave of the impulse, now approaching completion
When a five-wave impulse completes, Elliott Wave Theory predicts a corrective phase follows — typically retracing 38.2% to 61.8% of the entire impulse before the next major trend resumes. This is the setup to watch for in the coming weeks.
Key Support and Resistance Levels
$738.08 — All-Time High / Major Resistance
The intraday all-time high reached on May 8. A sustained break above $740 with strong volume and broad market breadth would signal the bull market continuation. Without that, this level acts as near-term resistance.
$733.86 — Pivot High
The DeMark pivot high. Price needs to hold above this level for the bullish structure to remain intact on a short-term basis.
$726.32 — First Support
The 20-day moving average and first meaningful support level. A pullback to this zone would be entirely healthy within the bull market context.
$707.04 — Key Support Zone
The Wave 4 low and the breakout level from the April consolidation. A break below $707 would signal a more significant correction has begun.
$693.05 — Major Support / 38.2% Fibonacci
The 38.2% Fibonacci retracement of the March–May rally. A pullback to this level would represent normal Wave A correction behavior and would offer a high-probability long entry for the next impulse higher.
$683.24 — Secondary Fibonacci Support
The 50% retracement level. This zone aligns with the previous April consolidation area and would represent maximum pain for bulls before a recovery.
$688.61 — Moving Average Support
Key moving average support identified by technical analysis. A break below this level on strong volume would be a significant bearish signal.
Technical Indicators — Overbought But Still Bullish
RSI at 76 — Approaching Overbought Extremes
The 14-day RSI is at 76 — deep in overbought territory. While RSI can remain elevated for extended periods in strong bull markets, readings above 75 have historically preceded short-term corrections or consolidations in SPY. This is not a reason to sell, but it is a reason to tighten stops and avoid chasing.
Elliott Wave — Wave 5 Nearing Completion
As outlined above, the five-wave impulse from the March lows appears to be in its final stages. Wave 5 structures often end with declining momentum — even as price makes new highs. Watch for RSI divergence (price making new high while RSI makes lower high) as the signal that Wave 5 is complete.
Moving Averages — Strongly Bullish
Both short-term and long-term moving averages are issuing buy signals, with the short-term average well above the long-term average. Support levels at $726.32 and $688.61 from moving averages provide a safety net on pullbacks.
MACD — Sell Signal on 3-Month
Despite the bullish short-term picture, the 3-month MACD is issuing a sell signal. This longer-term momentum divergence reinforces the case for caution at current levels.
Volume
Volume increased alongside the May 8 price rise — 46 million shares traded, approximately 1 million more than the previous session. Rising volume on up days is a positive technical signal confirming the buying interest.
Macro Catalysts — What Drives SPY From Here
Q1 Earnings Season — Blowout Results
The Magnificent Seven delivered exceptional Q1 2026 results across the board. Microsoft Azure grew 38% year-over-year. Meta’s AI infrastructure investments are paying off. Alphabet beat on Google Cloud. Amazon Web Services grew 26%. These results validated the AI investment thesis and drove SPY to all-time highs.
Iran-US Ceasefire and Oil Prices
The resolution of the Iran-US conflict and the reopening of the Strait of Hormuz has been the single biggest macro tailwind for SPY. With oil prices retreating from the $100+ spike, inflation fears are easing and Federal Reserve rate cut expectations are returning. Lower rates = higher equity valuations = SPY higher.
Federal Reserve — Rate Cuts Back on the Table
With oil prices normalising and Q1 GDP showing resilient growth, the Fed may now have the conditions to begin cutting rates in H2 2026. Markets are pricing in 1–2 cuts by year-end. Each cut would add approximately 5–8% to the fair value of the S&P 500, providing additional upside for SPY.
RBC Capital Markets — 7,900 S&P 500 Target
RBC Capital Markets raised its year-end S&P 500 target to 7,900, citing resilient earnings growth and continued AI-driven strength. At $737 SPY, this implies approximately 7% additional upside to year-end.
Trade Scenarios — Neutral to Bullish With Caution
Bullish Scenario (Primary):
SPY holds above $726 on any pullback, consolidates between $720–$740 for 1–2 weeks, then breaks to new ATH above $740 on strong volume with Fed rate cut confirmation. Target: $760–$780.
Neutral/Corrective Scenario:
Wave 5 completes at $738–$742 and SPY enters a corrective ABC decline. Wave A targets $693–$707, Wave B rebounds to $715–$725, Wave C declines to $680–$688 (61.8% Fib). Total correction: 8–10%. This would be entirely healthy and would set up the next major impulse higher.
Bearish Risk Scenario:
DJIA non-confirmation resolves to the downside, oil prices re-escalate on Iran breakdown, and SPY breaks below $683. In this scenario, the correction deepens toward $650–$660 (the April breakout level). This is the low-probability tail risk.
Invalidation for Bull Case: Daily close below $683 with strong volume.
SPY Price Targets for 2026
Conservative near-term target: $750–$760 (continuation of Wave 5)
Post-correction target: $760–$780 (after corrective ABC completes)
Year-end target: $780–$800 (aligning with RBC’s 7,900 S&P 500 target)
Long-term (2030) target: $722–$1,167 range (various analyst models)
Conclusion — SPY at ATH: Bullish But Watch for Wave 5 Exhaustion
SPY at $737 all-time highs is a bullish story driven by exceptional earnings, a macro tailwind from falling oil prices, and the prospect of Federal Reserve rate cuts in H2 2026. The medium and long-term outlook remains constructive.
However, the short-term picture demands caution. RSI at 76, Elliott Wave 5 nearing completion, MACD divergence on the 3-month timeframe, and the persistent DJIA non-confirmation are all warning that the easy money from the March lows has been made.
The playbook for the coming weeks: hold existing longs with tight stops above $707, do not chase new highs above $738, and watch for the corrective pullback to the $693–$707 zone as the next high-probability long entry.
Want real-time SPY levels, Elliott Wave counts, and precise trade setups? 48 HOURS ONLY — Lifetime Plan discount 30% 419 EUR + FREE €50,000 Funded Trading Account This offer closes in 48 hours. After that — monthly plan only. No exceptions. Access ProSignalTrades Premium →
Get Tomorrow’s Setup Before the Market Opens
Daily signals · Live dashboards · Private Telegram · From €39/mo
🛡️ 30-Day Money Back Guarantee · Cancel Anytime
—
Disclaimer: This analysis is for educational purposes only and does not constitute financial advice. Trading involves significant risk. Always conduct your own research before making trading decisions.