
prosignaltrades.com
  • Home
  • Stocks research
  • Features
  • Blog
  • Dashboard
  • Contact
May 31, 2026 by TraderNomad

GLD ETF Analysis: Why the SPDR Gold Shares Pullback to $408–$417 Is a Brilliant Buying Opportunity

GLD ETF Analysis: Why the SPDR Gold Shares Pullback to $408–$417 Is a Brilliant Buying Opportunity
May 31, 2026 by TraderNomad

The SPDR Gold Shares ETF (NYSE Arca: GLD) has pulled back sharply from its January 2026 all-time high of $509.70, trading around $412–$417 at the end of May 2026. After a parabolic rally that took GLD from $300 to above $500 in less than 12 months, the current correction has been significant — but for traders and investors who understand the technical and fundamental picture, this pullback represents one of the most compelling buying opportunities in the precious metals space.

Our outlook on GLD is firmly bullish. The WMA55 at $408.60 is providing dynamic support, the long-term trend remains fully intact, and the fundamental backdrop for Gold has not changed. We are buyers of the dip.

For broader precious metals context, also read our Gold XAU/USD Price Analysis and Silver XAG/USD Analysis.

SPDR Gold Shares official page — State Street
Live GLD price — Investing.com


ProSignalTrades
⏳  72 HOURS ONLY

Lifetime Premium + Funded Account

One payment.
Trade forever.

€479
€599
20% OFF
one time · forever

Lifetime Includes
—Private Telegram signals
—Two live trading dashboards
—Institutional stock research
—All future updates
—30-day money back
Free Bonus
€50,000
Funded Account — Free
—Trade with €50K capital
—Keep 80% of profits
—Zero personal risk

Coupon Code
LIFE20
Closes in
72:00:00

CLAIM LIFETIME ACCESS  →

🛡  30-Day Money Back Guarantee  ·  No Questions Asked

Access ProSignalTrades Premium →


What Is GLD? — The World’s Largest Gold ETF

The SPDR Gold Shares ETF (GLD) is the world’s largest physically-backed gold ETF, with a market capitalisation of over $150 billion. Managed by State Street Global Advisors, GLD holds physical gold bullion in London vaults and issues shares that represent approximately 1/10th of an ounce of gold. With an expense ratio of 0.40%, it is the simplest and most liquid way for investors to gain exposure to gold without the complexity of futures or physical storage.

GLD trades on the NYSE Arca and is included in virtually every major investment portfolio as a store of value, inflation hedge and safe-haven asset. Its price moves in near-perfect correlation with the spot gold price (XAU/USD).

GLD Chart Analysis — The Weekly Structure

Looking at the GLD weekly chart, the price action tells a clear story:

The Bull Market (Nov 2024 – Jan 2026):
From the November 2024 lows near $240, GLD staged one of the most powerful rallies in the ETF’s history — gaining over 112% to reach an all-time high of $509.70 in January 2026. This was driven by geopolitical risk (Iran conflict, Strait of Hormuz), central bank buying, dollar weakness and surging institutional demand.

The Correction (Feb – May 2026):
After the January ATH, GLD entered a corrective phase — dropping from $509.70 to the current $408–$417 zone. This represents a retracement of approximately 18–20% from the highs. In the context of a 112% bull market rally, this is entirely normal corrective behaviour.

The WMA55 — Dynamic Support:
The WMA55 (55-period Weekly Moving Average) is currently at $408.60 — providing dynamic support directly beneath current prices. GLD is testing this moving average for the first time since the bull market began. Historically, the first test of the WMA55 in a bull market trend represents a high-conviction buying opportunity.

The WMA189 — Long-Term Trend Anchor:
The WMA189 sits at $305.76 — far below current prices. This confirms that the long-term bull market in Gold is fully intact. The correction from $509.70 to $417 has not come close to threatening the structural uptrend.

Key Support and Resistance Levels
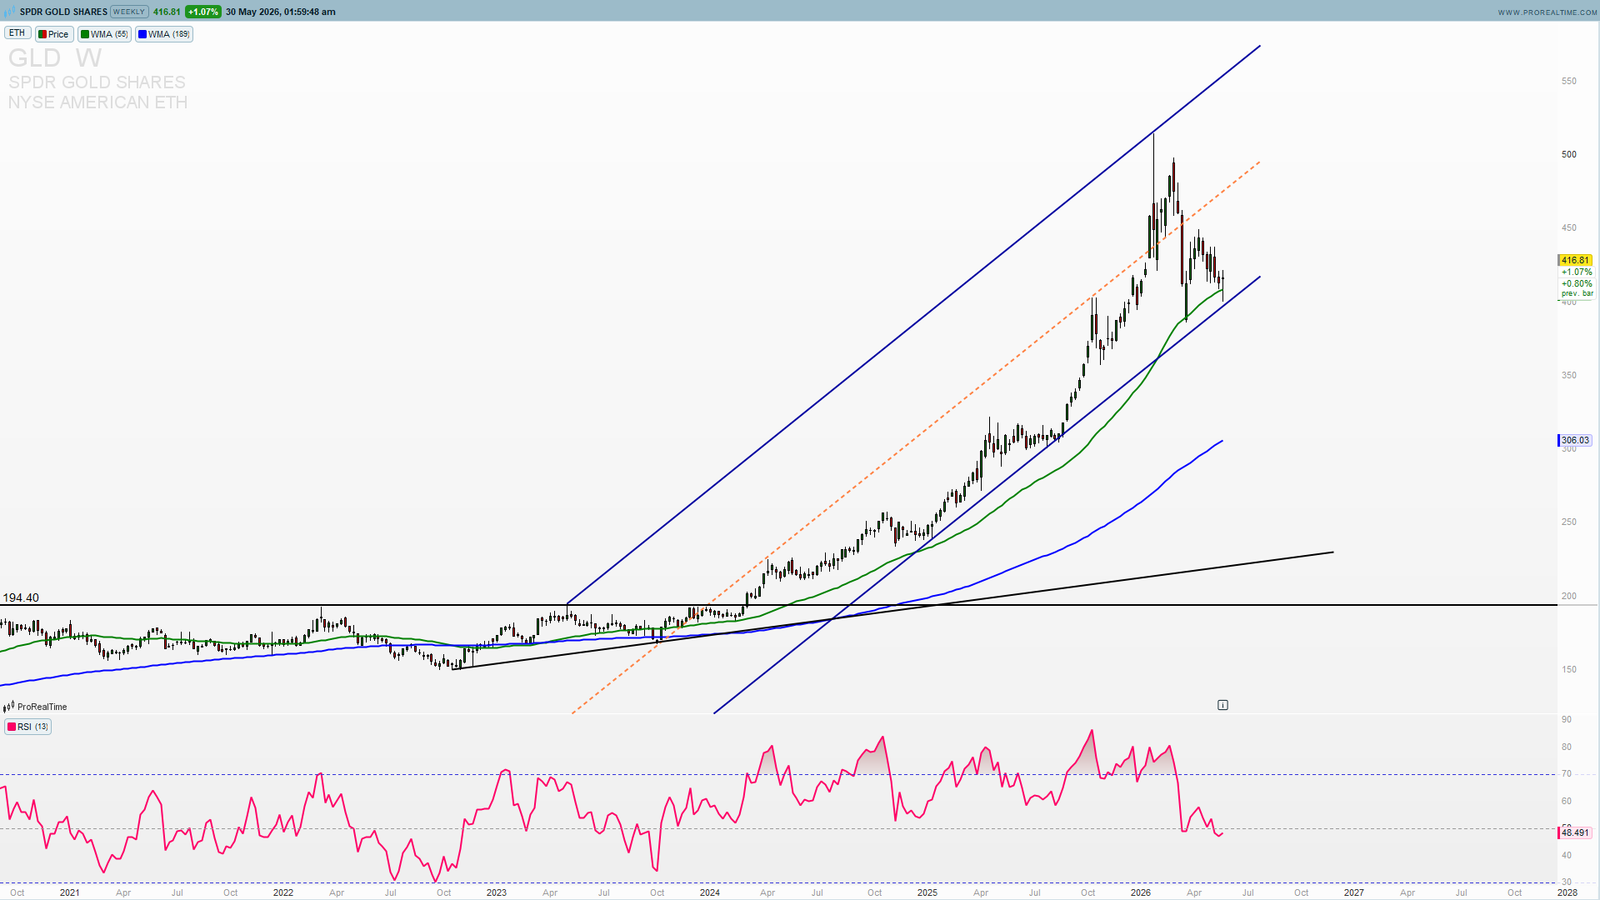
GLD weekly chart support and resistance

$509.70 — All-Time High
The January 2026 ATH. A recovery to this level would represent a 23% gain from current prices and would confirm the bull market is resuming.

$460–$480 — Major Resistance Zone
The range where GLD spent significant time in late 2025 before the final leg higher. Reclaiming this zone would be a strong bullish signal.

$430–$440 — Near-Term Resistance
The first meaningful resistance above current levels. A sustained break above $440 would signal the correction is over.

$417.12 — Current Price / Pivot
GLD is trading around $417 — at the pivot between the WMA55 support below and the $430–$440 resistance above.

$408.60 — WMA55 / Critical Support
The most important technical level in the current setup. The WMA55 has acted as dynamic support throughout GLD’s entire bull market run. A hold at this level followed by a bullish weekly close above $420 would be the ideal buy signal.

$395–$400 — Secondary Support
The psychological $400 round number and the previous resistance-turned-support zone. A break below $408 would test this level next.

$380 — Deep Support
In the event of a more aggressive correction, the $380 zone aligns with the 38.2% Fibonacci retracement of the entire bull market rally.

$299.89 — 52-Week Low
The floor of the entire bull market move. The uptrend is intact as long as GLD remains above this level.

Why GLD Is a Buy at Current Levels

WMA55 First Test in the Bull Market
GLD is testing its 55-week WMA for the first time since the bull market began. In previous Gold bull markets, the first WMA55 test has consistently been a buying opportunity before the next leg higher. The current setup fits this pattern precisely.

Correction Within a Structural Bull Market
An 18–20% pullback from ATH after a 112% rally is mathematically healthy. The bull market is not over — it is consolidating. Long-term investors and traders who understand this distinction buy corrections, not tops.

Fundamental Backdrop Remains Bullish
The factors that drove Gold from $300 to $509 have not disappeared. Central bank gold buying continues to break records. The US dollar faces structural headwinds. Geopolitical uncertainty — particularly the ongoing Iran situation and Strait of Hormuz tension — remains elevated. None of these fundamental drivers have reversed.

Gold at $4,700 Per Ounce
With spot Gold (XAU/USD) trading around $4,700–$4,720 per ounce, and GLD at $417 (equivalent to approximately 1/10th of an ounce), GLD’s valuation aligns directly with the Gold spot price. Any recovery in XAU/USD toward $5,000 and beyond would translate directly into GLD price appreciation.

52-Week Performance Still +38%
Despite the correction from ATH, GLD’s 52-week performance remains approximately +38% — one of the strongest performances of any major ETF over this period. This confirms the fundamental momentum behind Gold is extraordinary.

GLD vs IAU — Which Gold ETF Is Better?

Investors often compare GLD with the iShares Gold Trust (IAU). The key differences:

GLD (SPDR Gold Shares): Expense ratio 0.40%, higher liquidity, preferred by institutional traders, represents ~1/10th oz of gold per share.

IAU (iShares Gold Trust): Expense ratio 0.25%, slightly lower cost for long-term holders, represents ~1/100th oz per share (lower price per unit).

For long-term investors focused on cost efficiency, IAU’s lower expense ratio is an advantage. For active traders who prioritise liquidity and options markets, GLD is the preferred choice. Both track the gold price with near-identical accuracy.

Trade Scenarios — Bullish

Primary Bullish Scenario:
GLD holds the WMA55 at $408.60, produces a weekly close above $420, and begins recovering toward the $430–$440 resistance zone. Subsequent break above $440 opens the door to $460–$480 and eventually a retest of the $509.70 ATH.
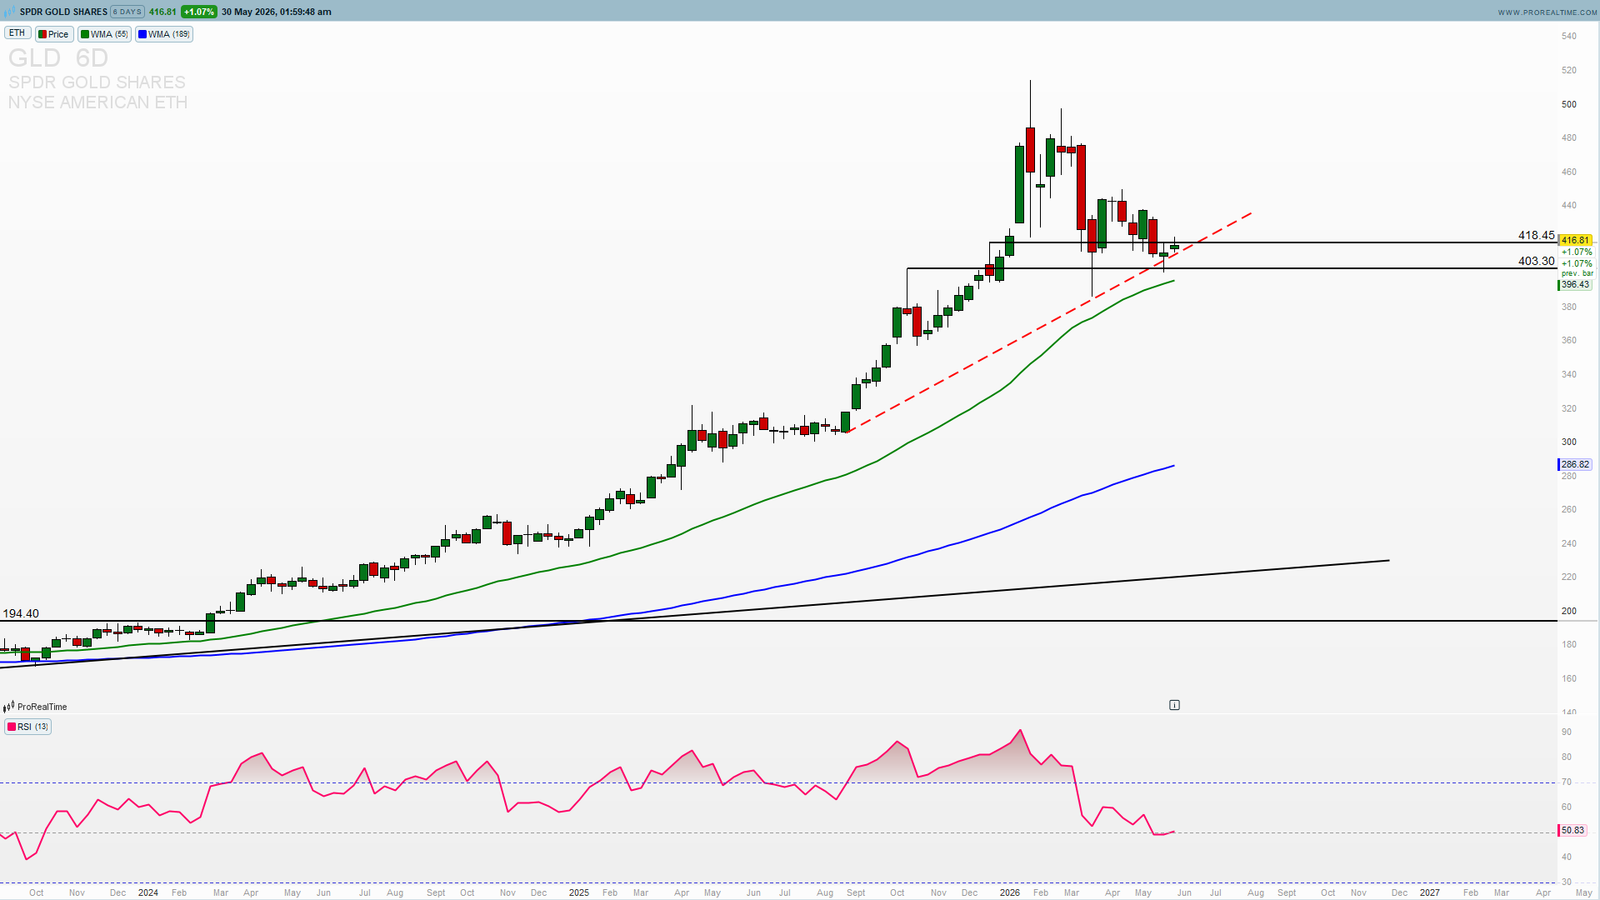
GLD bullish daily chart

Extended Bull Scenario:
Gold fundamentals re-accelerate — dollar weakness, Fed rate cuts, central bank buying, Iran escalation. GLD breaks through $509.70 ATH and targets $550–$600 by year-end 2026.

Bearish Risk:
A weekly close below $408.60 (WMA55) with strong volume would signal a deeper correction toward $395–$400, then potentially $380. Catalyst: unexpected US dollar strength, rapid Iran peace resolution reducing safe-haven demand, or a significant equity market rally drawing capital away from Gold.

Invalidation for Bull Case: Weekly close below $380.

GLD Price Targets 2026

Near-term target: $440–$460 (recovery from WMA55 support)
Base case target: $480–$509 (retest ATH)
Bull case target: $550–$600 (new ATH extension)
5-Year forecast: $1,158 (WalletInvestor long-term model based on current trajectory)

Conclusion — GLD at $408–$417 Is a High-Conviction Buy

The SPDR Gold Shares ETF testing its 55-week WMA for the first time in a 112% bull market rally, with fundamental Gold drivers fully intact and institutional demand at record levels, is precisely the kind of setup that long-term investors should embrace rather than fear.

The correction from $509.70 to $417 is not the end of the Gold bull market. It is the buying opportunity within it.

Watch $408.60 (WMA55). Watch for a weekly close above $420. That is the signal that the next leg higher has begun.

Want real-time GLD levels, Elliott Wave counts, and precise trade setups? Access ProSignalTrades Premium →

—
Disclaimer: This analysis is for educational purposes only and does not constitute financial advice. Trading involves significant risk. Always conduct your own research before making trading decisions.

Previous articleProSignalTrades Review — What's Included and Is It Worth It in 2026?If you've landed on this page, you're probably wondering whether ProSignalTrades is worth your money. Fair question. The trading signals industry is full of low-quality services that promise the world and deliver nothing. In this honest, detailed review we break down exactly what ProSignalTrades offers, what you get at each plan level, how the signals are generated, and whether the platform delivers real value for serious traders. What Is ProSignalTrades? ProSignalTrades is a premium trading research and signals platform built by a trader with over 15 years of market experience. The platform uses Elliott Wave Theory, Price Action analysis and Fundamental research to generate precise trade setups across five major asset classes: Gold (XAU/USD) and Silver (XAG/USD) WTI Crude Oil S&P 500 Futures (SPX) and Nasdaq 100 (NAS100) Individual stocks and ETFs Forex pairs The platform covers Futures, Stocks and CFDs — making it relevant whether you trade through a broker offering CFDs, a futures account, or a stock brokerage. What Do You Actually Get? ProSignalTrades includes five core components across its membership plans: 1. Two Live Trading Dashboards Members get access to two professional-grade, real-time trading dashboards: Stocks Dashboard (stocks.prosignaltrades.com) — A Bloomberg-style interface for US equities and ETFs. Features include a fully customisable watchlist, candlestick and line charts across 15 timeframes (15 minutes to 10 years), pre-market and after-hours price data, live news feed powered by real-time financial data, and a ticker tape showing live prices for all major indices and commodities. Trading Dashboard (trading.prosignaltrades.com) — A comprehensive multi-asset dashboard showing live quotes for Gold, Silver, Oil, all major Forex pairs, Indices and Crypto. Features a real-time news feed, TradingView-powered charts, and trade setup alerts. Both dashboards are built in-house, mobile-responsive, and update in real time during market hours. 2. Telegram Private Signals Feed All members receive access to the ProSignalTrades private Telegram channel, where automated live trading signals are delivered the moment they are generated. Every signal includes: Instrument and direction (BUY or SELL) Entry price Stop loss level Take profit target Live balance and open P/L tracking Timeframe (D1, H4, H1) Signals cover USTEC (Nasdaq 100), UK100 (FTSE), US2000 (Russell 2000), Gold, Oil and more. The automation means signals reach your phone instantly — not hours after the setup has already moved. 3. Weekly Analysis Newsletter Every week, members receive a detailed market analysis covering all major instruments. The weekly overview includes Elliott Wave counts, key support and resistance levels, directional bias and specific trade setups with entry, stop and target levels. For Pro Annual and Premium Lifetime members, the weekly analysis also includes the full Weekly Futures Market Overview — a paywall-protected deep-dive into SPX, NAS100, DAX, WTI Oil and Gold futures for the week ahead. 4. Institutional Stock Research Reports Pro Annual and Premium Lifetime members get access to institutional-grade equity research reports covering S&P 500 stocks. These reports include: Full fundamental analysis Valuation metrics and ratios Wall Street consensus and price targets Elliott Wave technical overlay Buy / Hold / Sell rating Current coverage includes Alphabet (GOOGL), NVIDIA (NVDA) and expanding weekly. These are the same style of reports produced by institutional research desks — now accessible to individual traders. 5. WhatsApp Trade Alerts Pro Annual and Premium Lifetime members receive direct WhatsApp alerts for key trade setups. This is the fastest way to receive time-sensitive signals when you are away from your screens. The Three Plans — Which Is Right for You? Basic Plan — €39/month The entry-level plan gives you: Both live trading dashboards Telegram private signals feed Weekly market newsletter Cancel anytime Best for: traders who want live market intelligence and automated signals without committing to an annual plan. Pro Annual — €199/year The most popular plan gives you everything in Basic, plus: Precise entry points, stop losses and price targets Weekly Futures Market Overview (paywall content) Institutional stock research reports WhatsApp trade alerts At €199/year — that is €16.58/month — this represents exceptional value compared to traditional financial research services that charge €500–€2,000/month for comparable coverage. Premium Lifetime — €599 one-time The ultimate plan for serious traders who want permanent access: All Pro Annual features Institutional stock research reports Priority WhatsApp support Direct analyst access Prop trading challenge account for free Lifetime updates — no renewals ever At €599 one-time, Premium Lifetime pays for itself in under 3 years compared to the monthly Basic plan — and in 4 months compared to comparable professional research services. The Track Record — Does It Actually Work? ProSignalTrades publishes a growing track record of documented trade setups. Notable examples include: Gold Short — April 2026 Entry: $5,375 | Stop: $5,470 | Target: $4,886 Result: TARGET HIT ✅ — Gold fell from $5,400 to $4,676, well through the target. USTEC Sell Signals — April 28, 2026 Multiple SELL USTEC signals at 27,283–27,288. Open P/L within 24 hours: +$269–$275 per position ✅ QQQ ETF Analysis — March 2026 Published when QQQ was at $558 with RSI at 19.5 (extreme oversold). Called neutral-to-bullish. QQQ subsequently rallied to $648 — a 16% gain ✅ NAS100 Pullback Call — April 2026 Called the pullback from 26,000 after a near-vertical rally. Nasdaq subsequently pulled back from 26,296 ATH as predicted ✅ Who Is ProSignalTrades For? ProSignalTrades is designed for: Active traders who trade Gold, Oil, Indices or Stocks and need precise, actionable setups Investors who want institutional-quality equity research without paying for a Bloomberg terminal Part-time traders who cannot monitor markets all day but want signals delivered directly to their phone Educators and analysts who want to deepen their understanding of Elliott Wave and Price Action methodology ProSignalTrades is not for: traders looking for automated copy-trading, algorithmic trading systems, or get-rich-quick signal services with unrealistic win rate claims. The 30-Day Money-Back Guarantee Every ProSignalTrades plan comes with a 30-day money-back guarantee. If you are not satisfied within 30 days, you receive a full refund — no questions asked. This removes all risk from your initial purchase. Final Verdict — Is ProSignalTrades Worth It? Yes — for serious traders who understand that edge in financial markets comes from better information, better methodology and better discipline. ProSignalTrades delivers all three: Better information — two live dashboards, real-time Telegram signals, institutional equity research Better methodology — 15+ years of Elliott Wave and Price Action experience, with a documented and growing track record Better discipline — every setup includes entry, stop loss and target — removing guesswork and emotion from your trading decisions At €16.58/month for the Pro Annual plan — that is less than the cost of a single bad trade. If even one setup saves you from a losing position or identifies a winning trade you would have missed, the subscription pays for itself many times over. Get started with ProSignalTrades → --- Disclaimer: Trading involves significant risk of loss. Past performance is not indicative of future results. This review is written by the platform operator. Always conduct your own due diligence before subscribing to any trading service.

Leave a Reply Cancel reply

Your email address will not be published. Required fields are marked *

Premium and free trade analysis articles

Recent Posts

GLD ETF Analysis: Why the SPDR Gold Shares Pullback to $408–$417 Is a Brilliant Buying OpportunityMay 31, 2026
ProSignalTrades Review — What’s Included and Is It Worth It in 2026?May 26, 2026
NVIDIA Stock Analysis: Why the $200 Support Is the Most Powerful Buying Zone in the AI RevolutionMay 24, 2026

Categories

  • Trade analysis

Tags

Crude Oil Technical Analysis Elliott Wave Elliott Wave Signals GLD Analysis GLD ETF GLD Price Target GLD Technical Analysis Gold Buy the Dip Gold ETF 2026 Invesco QQQ Iran Oil Nasdaq-100 Nasdaq ETF NVDA NVDA Elliott Wave NVDA Price Target NVDA Stock Analysis NVDA Technical Analysis NVIDIA NVIDIA 2026 NVIDIA AI NVIDIA Bullish Oil Bullish Oil Forecast ProSignalTrades ProSignalTrades 2026 ProSignalTrades Review QQQ 2026 QQQ ETF Analysis QQQ Price Target QQQ Technical Analysis Silver Analysis Silver Buy the Dip Silver Elliott Wave Silver Price Forecast Silver Technical Analysis Silver XAG/USD SPDR Gold Shares SPDR Gold Trust Strait of Hormuz Trading Research Platform Trading Signals Review WTI 2026 XAGUSD 2026 XAG USD Outlook

Why PST

15+ years of trading experience — analysis built on real market knowledge, not theory.

Get Started Now!

Contact

info@prosignaltrades.com

Recent Posts

GLD ETF Analysis: Why the SPDR Gold Shares Pullback to $408–$417 Is a Brilliant Buying OpportunityMay 31, 2026
ProSignalTrades Review — What’s Included and Is It Worth It in 2026?May 26, 2026
NVIDIA Stock Analysis: Why the $200 Support Is the Most Powerful Buying Zone in the AI RevolutionMay 24, 2026
ProSignalTrades Wordpress Theme. Proudly Built By PST
TOS and Privacy Policy

Recent Posts

GLD ETF Analysis: Why the SPDR Gold Shares Pullback to $408–$417 Is a Brilliant Buying OpportunityMay 31, 2026
ProSignalTrades Review — What’s Included and Is It Worth It in 2026?May 26, 2026
NVIDIA Stock Analysis: Why the $200 Support Is the Most Powerful Buying Zone in the AI RevolutionMay 24, 2026
✕