For our current gold and silver setups, read the Gold Bearish Setup and the SLV Forecast.
The SPDR Gold Shares ETF (NYSE Arca: GLD) has pulled back sharply from its January 2026 all-time high of $509.70, trading around $412–$417 at the end of May 2026. After a parabolic rally that took GLD from $300 to above $500 in less than 12 months, the current correction has been significant — but for traders and investors who understand the technical and fundamental picture, this pullback represents one of the most compelling buying opportunities in the precious metals space.
Our outlook on GLD is firmly bullish. The WMA55 at $408.60 is providing dynamic support, the long-term trend remains fully intact, and the fundamental backdrop for Gold has not changed. We are buyers of the dip.
For broader precious metals context, also read our Gold XAU/USD Price Analysis and Silver XAG/USD Analysis.
SPDR Gold Shares official page — State Street
Live GLD price — Investing.com
📊 Featured Research
Want the full institutional-grade breakdown on SpaceX (SPCX)? Our latest research report covers fundamentals, technicals, and risk profile — BUY rating, $197.33 price target (+22.61% upside).
What Is GLD? — The World’s Largest Gold ETF
The SPDR Gold Shares ETF (GLD) is the world’s largest physically-backed gold ETF, with a market capitalisation of over $150 billion. Managed by State Street Global Advisors, GLD holds physical gold bullion in London vaults and issues shares that represent approximately 1/10th of an ounce of gold. With an expense ratio of 0.40%, it is the simplest and most liquid way for investors to gain exposure to gold without the complexity of futures or physical storage.
GLD trades on the NYSE Arca and is included in virtually every major investment portfolio as a store of value, inflation hedge and safe-haven asset. Its price moves in near-perfect correlation with the spot gold price (XAU/USD).
GLD Chart Analysis — The Weekly Structure
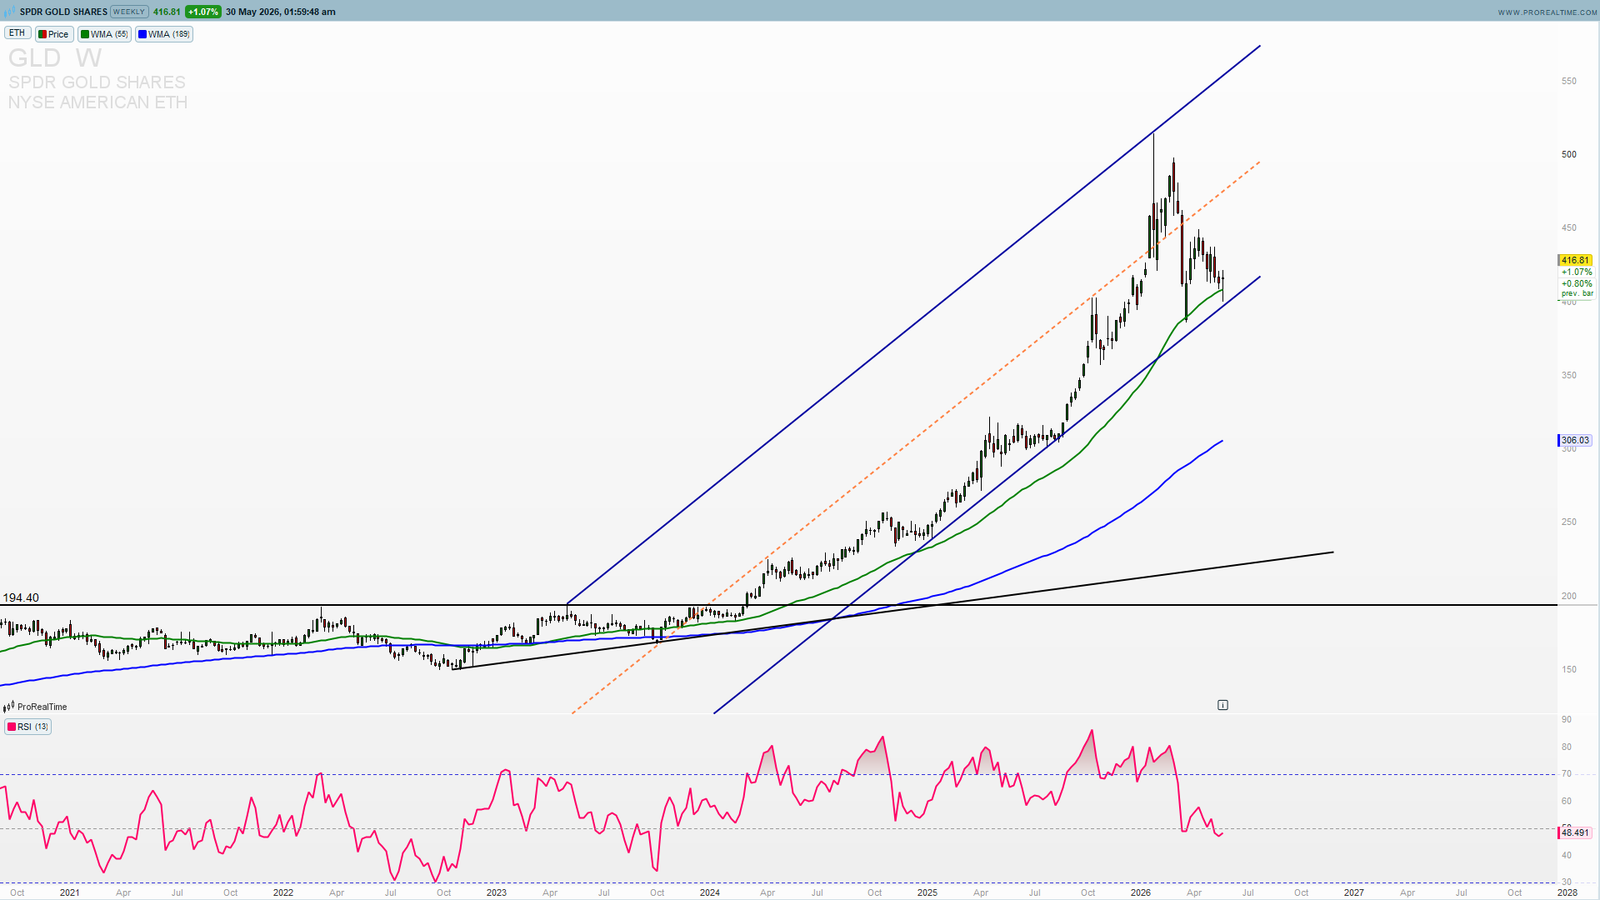
Looking at the GLD weekly chart, the price action tells a clear story:
The Bull Market (Nov 2024 – Jan 2026):
From the November 2024 lows near $240, GLD staged one of the most powerful rallies in the ETF’s history — gaining over 112% to reach an all-time high of $509.70 in January 2026. This was driven by geopolitical risk (Iran conflict, Strait of Hormuz), central bank buying, dollar weakness and surging institutional demand.
The Correction (Feb – May 2026):
After the January ATH, GLD entered a corrective phase — dropping from $509.70 to the current $408–$417 zone. This represents a retracement of approximately 18–20% from the highs. In the context of a 112% bull market rally, this is entirely normal corrective behaviour.
The WMA55 — Dynamic Support:
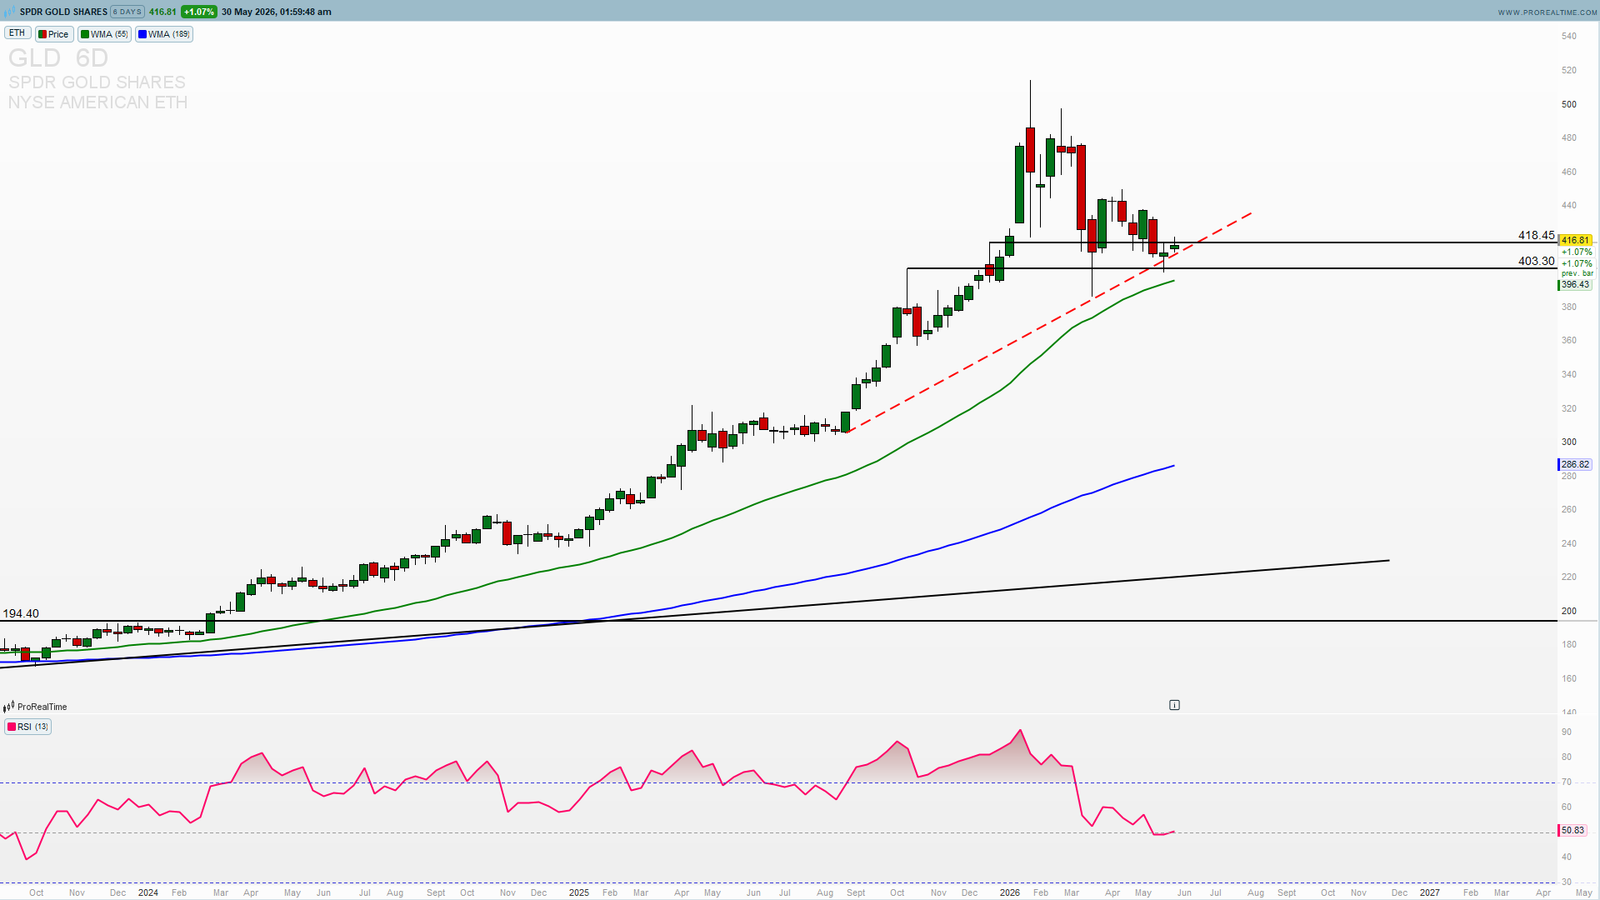
The WMA55 (55-period Weekly Moving Average) is currently at $408.60 — providing dynamic support directly beneath current prices. GLD is testing this moving average for the first time since the bull market began. Historically, the first test of the WMA55 in a bull market trend represents a high-conviction buying opportunity.
The WMA189 — Long-Term Trend Anchor:
The WMA189 sits at $305.76 — far below current prices. This confirms that the long-term bull market in Gold is fully intact. The correction from $509.70 to $417 has not come close to threatening the structural uptrend.
Key Support and Resistance Levels
$509.70 — All-Time High
The January 2026 ATH. A recovery to this level would represent a 23% gain from current prices and would confirm the bull market is resuming.
$460–$480 — Major Resistance Zone
The range where GLD spent significant time in late 2025 before the final leg higher. Reclaiming this zone would be a strong bullish signal.
$430–$440 — Near-Term Resistance
The first meaningful resistance above current levels. A sustained break above $440 would signal the correction is over.
$417.12 — Current Price / Pivot
GLD is trading around $417 — at the pivot between the WMA55 support below and the $430–$440 resistance above.
$408.60 — WMA55 / Critical Support
The most important technical level in the current setup. The WMA55 has acted as dynamic support throughout GLD’s entire bull market run. A hold at this level followed by a bullish weekly close above $420 would be the ideal buy signal.
$395–$400 — Secondary Support
The psychological $400 round number and the previous resistance-turned-support zone. A break below $408 would test this level next.
$380 — Deep Support
In the event of a more aggressive correction, the $380 zone aligns with the 38.2% Fibonacci retracement of the entire bull market rally.
$299.89 — 52-Week Low
The floor of the entire bull market move. The uptrend is intact as long as GLD remains above this level.
Why GLD Is a Buy at Current Levels
WMA55 First Test in the Bull Market
GLD is testing its 55-week WMA for the first time since the bull market began. In previous Gold bull markets, the first WMA55 test has consistently been a buying opportunity before the next leg higher. The current setup fits this pattern precisely.
Correction Within a Structural Bull Market
An 18–20% pullback from ATH after a 112% rally is mathematically healthy. The bull market is not over — it is consolidating. Long-term investors and traders who understand this distinction buy corrections, not tops.
Fundamental Backdrop Remains Bullish
The factors that drove Gold from $300 to $509 have not disappeared. Central bank gold buying continues to break records. The US dollar faces structural headwinds. Geopolitical uncertainty — particularly the ongoing Iran situation and Strait of Hormuz tension — remains elevated. None of these fundamental drivers have reversed.
Gold at $4,700 Per Ounce
With spot Gold (XAU/USD) trading around $4,700–$4,720 per ounce, and GLD at $417 (equivalent to approximately 1/10th of an ounce), GLD’s valuation aligns directly with the Gold spot price. Any recovery in XAU/USD toward $5,000 and beyond would translate directly into GLD price appreciation.
52-Week Performance Still +38%
Despite the correction from ATH, GLD’s 52-week performance remains approximately +38% — one of the strongest performances of any major ETF over this period. This confirms the fundamental momentum behind Gold is extraordinary.
GLD vs IAU — Which Gold ETF Is Better?
Investors often compare GLD with the iShares Gold Trust (IAU). The key differences:
GLD (SPDR Gold Shares): Expense ratio 0.40%, higher liquidity, preferred by institutional traders, represents ~1/10th oz of gold per share.
IAU (iShares Gold Trust): Expense ratio 0.25%, slightly lower cost for long-term holders, represents ~1/100th oz per share (lower price per unit).
For long-term investors focused on cost efficiency, IAU’s lower expense ratio is an advantage. For active traders who prioritise liquidity and options markets, GLD is the preferred choice. Both track the gold price with near-identical accuracy.
Trade Scenarios — Bullish
Primary Bullish Scenario:
GLD holds the WMA55 at $408.60, produces a weekly close above $420, and begins recovering toward the $430–$440 resistance zone. Subsequent break above $440 opens the door to $460–$480 and eventually a retest of the $509.70 ATH.
Extended Bull Scenario:
Gold fundamentals re-accelerate — dollar weakness, Fed rate cuts, central bank buying, Iran escalation. GLD breaks through $509.70 ATH and targets $550–$600 by year-end 2026.
Bearish Risk:
A weekly close below $408.60 (WMA55) with strong volume would signal a deeper correction toward $395–$400, then potentially $380. Catalyst: unexpected US dollar strength, rapid Iran peace resolution reducing safe-haven demand, or a significant equity market rally drawing capital away from Gold.
Invalidation for Bull Case: Weekly close below $380.
GLD Price Targets 2026
Near-term target: $440–$460 (recovery from WMA55 support)
Base case target: $480–$509 (retest ATH)
Bull case target: $550–$600 (new ATH extension)
5-Year forecast: $1,158 (WalletInvestor long-term model based on current trajectory)
Conclusion — GLD at $408–$417 Is a High-Conviction Buy
The SPDR Gold Shares ETF testing its 55-week WMA for the first time in a 112% bull market rally, with fundamental Gold drivers fully intact and institutional demand at record levels, is precisely the kind of setup that long-term investors should embrace rather than fear.
The correction from $509.70 to $417 is not the end of the Gold bull market. It is the buying opportunity within it.
Watch $408.60 (WMA55). Watch for a weekly close above $420. That is the signal that the next leg higher has begun.
Want real-time GLD levels, Elliott Wave counts, and precise trade setups? Access ProSignalTrades Premium →
—
Disclaimer: This analysis is for educational purposes only and does not constitute financial advice. Trading involves significant risk. Always conduct your own research before making trading decisions.