Bitcoin (BTC/USD) is at one of the most critical technical junctures of 2026. After reaching a high near $84,650 in April, BTC has entered a sharp corrective phase — dropping to $62,285 on the weekly chart, with the RSI at a deeply oversold 33 and the Fear & Greed Index at 12 — Extreme Fear. The selling has been driven by record spot ETF outflows, leveraged long liquidations and macro headwinds from a Federal Reserve that shows no urgency to cut rates.
The question every Bitcoin trader is asking: is this the buying opportunity of 2026, or is a deeper crash incoming?
Our analysis identifies two critical pivot levels: below $60,000 is bearish and signals deeper correction, while above $67,000 is bullish and signals the recovery has begun.
For broader market context, also read our SPY S&P 500 Analysis and Gold XAU/USD Analysis.
Live Bitcoin BTC/USD price — Investing.com
Crypto Fear & Greed Index
📊 Featured Research
Want the full institutional-grade breakdown on SpaceX (SPCX)? Our latest research report covers fundamentals, technicals, and risk profile — BUY rating, $197.33 price target (+22.61% upside).
What Caused the Bitcoin Selloff in May–June 2026
The current Bitcoin correction is not random. It has been driven by a clear set of fundamental and structural catalysts:
Record Spot ETF Outflows — $3.4 Billion in One Week
Bitcoin spot ETFs recorded their largest weekly outflows since launch in January 2024 — $3.4 billion in a single week. This signals institutional repositioning and represents significant selling pressure that overwhelmed spot demand.
$1.8 Billion in Leveraged Long Liquidations
A cascade of leveraged long liquidations added fuel to the selloff, with over $1.8 billion in forced selling across major exchanges in a compressed timeframe.
Strategy’s First BTC Sale in Four Years
MicroStrategy (now Strategy) sold Bitcoin for the first time in four years — a headline that rattled institutional confidence in BTC as a corporate treasury reserve asset.
Federal Reserve — Higher for Longer
The Federal Reserve has repeatedly signalled no urgency to cut rates in 2026. Higher real yields reduce the relative attractiveness of non-yielding assets like Bitcoin.
Geopolitical Uncertainty
Renewed US-Iran tensions and broader macro uncertainty have driven capital toward safe-haven assets like Gold and away from risk assets including crypto.
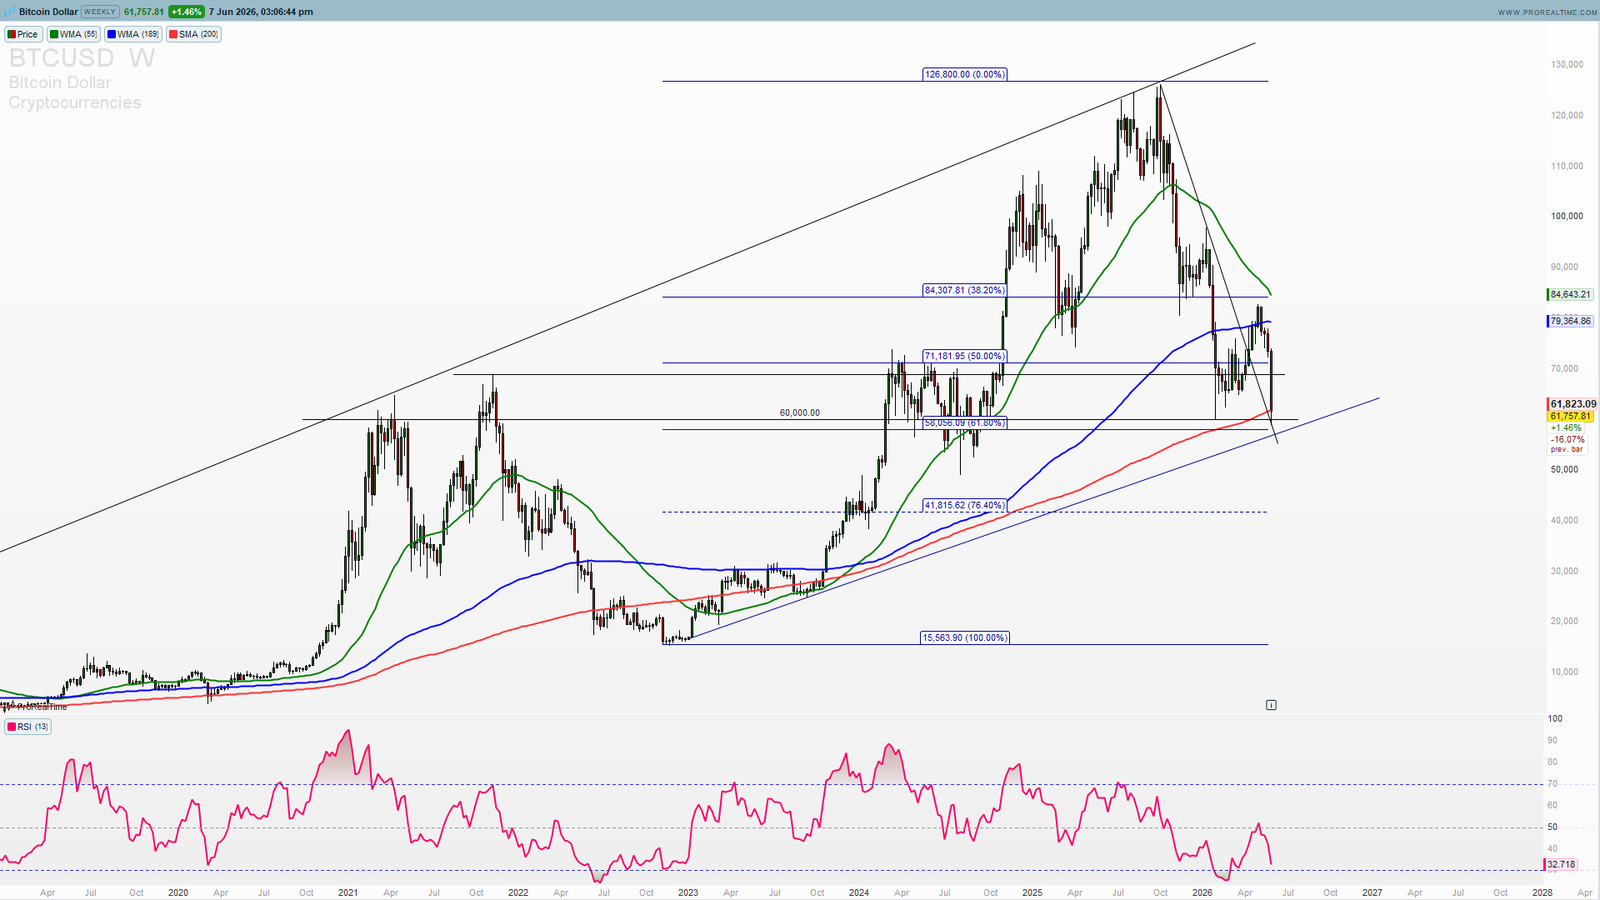
Bitcoin Technical Analysis — The Weekly Chart
Looking at the BTC/USD weekly chart, several critical technical observations emerge:
The Parabolic Rise and Fall Pattern
Bitcoin’s chart shows a classic parabolic blow-off structure. From the 2024 lows, BTC rallied parabolically to the January 2026 highs near $108,000–$109,000 — driven by halving anticipation and ETF inflows. Since that peak, the correction has been sharp, with BTC dropping over 42% from peak to current levels.
RSI at 33 — Approaching Oversold
The weekly RSI is at 33.06 — approaching the oversold territory below 30 that has historically preceded Bitcoin’s most powerful recoveries. The last time weekly RSI was at this level was during the 2024 accumulation phase before Bitcoin rallied from $60,000 to $109,000.
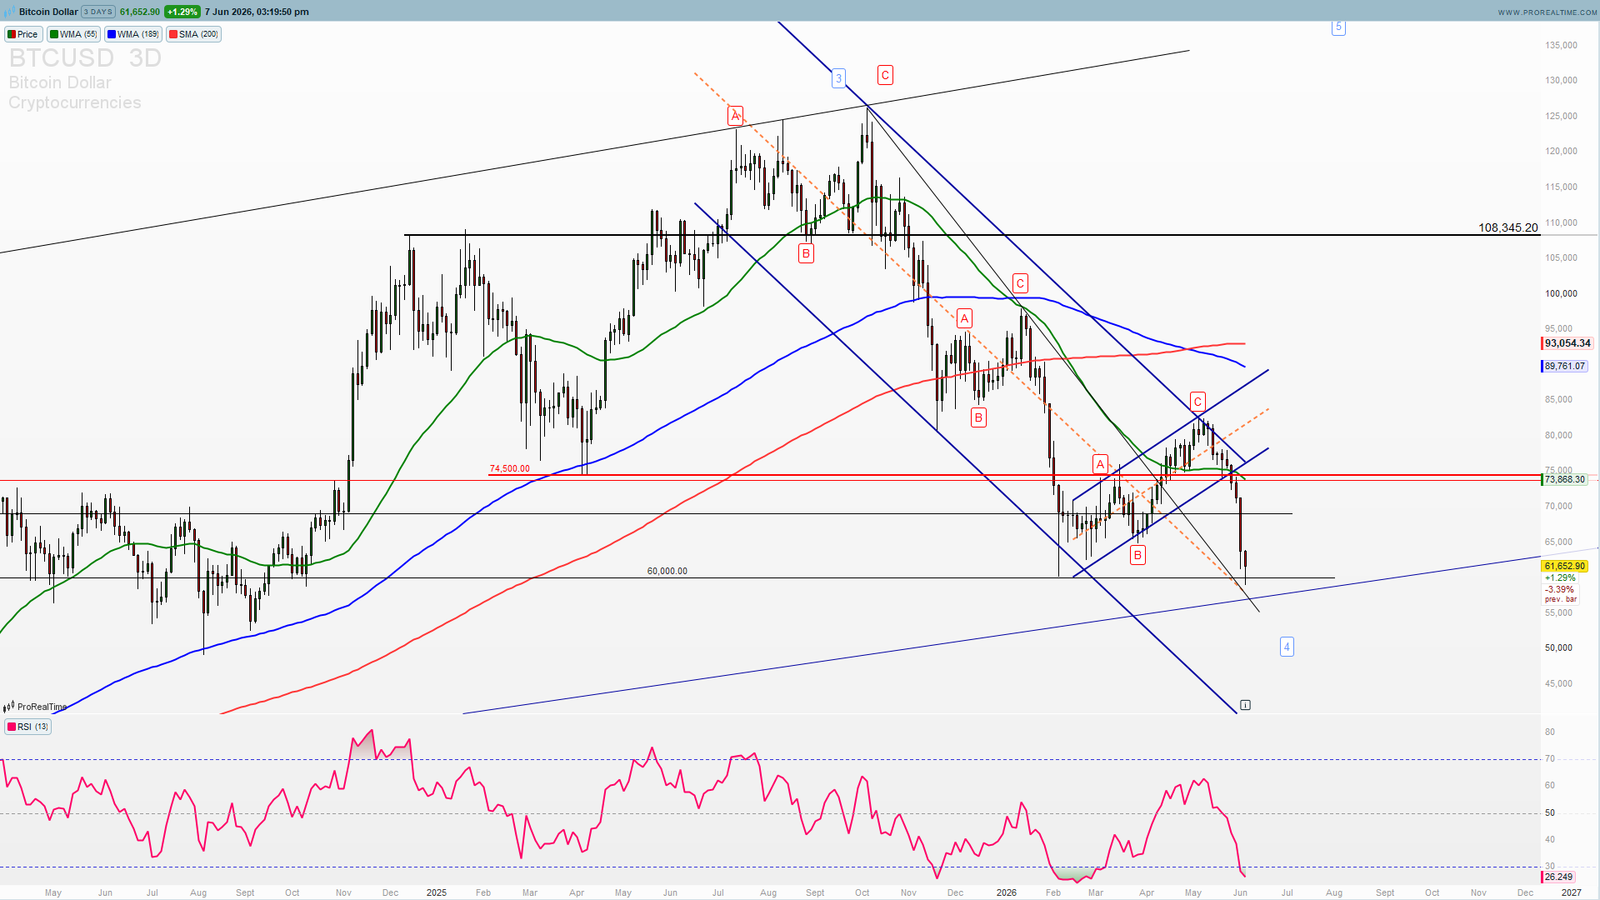
Elliott Wave — Wave 4 or Wave 2 Correction
The price action since the January 2026 high is consistent with either a Wave 4 correction within a larger impulse, or a Wave 2 correction in the next cycle. Both scenarios are bullish on the medium-term timeframe. The key question is whether the corrective low is already in at the $59,097 weekly low, or whether a final leg down to the $51,000–$55,000 zone is still ahead.
Parallel Channel Support
The ascending parallel channel that has defined Bitcoin’s bull market structure since 2023 still provides support in the $60,000–$63,000 zone. A hold above the lower channel boundary would be a significant technical positive.
The Two Critical Pivot Levels
$60,000 — The Line in the Sand (BEARISH BELOW)
The $60,000 level is the single most important support for Bitcoin in the current environment. It represents the psychological round number, the lower boundary of the ascending parallel channel, and the 0.786 Fibonacci retracement of the rally from the 2024 lows.
If Bitcoin breaks and sustains below $60,000 on a weekly close basis, the technical picture deteriorates significantly:
The next support zone is $55,000–$57,000 (50% Fibonacci retracement)
Below that, $51,846 becomes the target
A move to $43,000–$48,000 cannot be excluded in a deep correction scenario
$67,000 — The Recovery Signal (BULLISH ABOVE)
The $67,000 level represents the 0.618 Fibonacci golden ratio recovery level and the breakdown level from the May correction. A sustained close above $67,000 would signal:
The corrective phase is over and the bull market is resuming.
ETF outflows have stabilised and institutional buyers are returning.
The $75,000–$80,000 zone becomes the next target.
Key levels between the two pivots:
$63,339 — horizontal resistance from the weekly chart
$60,192 — immediate support floor
$59,097 — weekly candle low (recent)
$67,202 — first recovery target
$75,725 — medium-term bull target
$79,359 — next significant resistance
$84,651 — ATH resistance zone
Why the Risk/Reward Is Interesting at Current Levels
With Bitcoin at $62,285 and the $60,000 support just below:
Risk: If $60,000 breaks, the downside is $51,000–$55,000 — approximately 11–18% downside.
Reward: If $60,000 holds and recovery to $84,000 plays out — approximately 35% upside.
Risk/Reward ratio: approximately 1:2 to 1:3 — an acceptable setup for a positioned long trade with a tight stop below $59,000.
The RSI at 33, Fear & Greed at 12, and weekly oversold oscillators all confirm that this is not the time to be selling Bitcoin — it is the time to be watching for the recovery signal above $67,000.
Macro Catalysts to Watch
Bitcoin ETF Flows — The Most Important Signal
A reversal in ETF outflows to net inflows would be the single strongest bullish signal for Bitcoin’s short-term price action.
Federal Reserve Rate Decision
Any shift in Fed language toward rate cuts would be a significant positive for risk assets including Bitcoin.
US-Iran Geopolitical Resolution
A resolution of the Iran situation would reduce safe-haven demand — potentially redirecting flows back toward Bitcoin.
Strategy and Corporate BTC Buyers
Any announcement of resumed corporate Bitcoin purchases would restore institutional confidence in the asset class.
—
SOFI20
📱 Telegram Signals Feed
💬 WhatsApp Alerts
🛡️ 30-Day Guarantee
Claim 20% OFF — Use Code SOFI20 →
—
Bitcoin Outlook June 2026 — Summary
Bitcoin at $62,285 is in a technically oversold condition following a 42% correction from the January 2026 highs. The RSI at 33, Fear & Greed at 12, and weekly oscillators approaching extreme levels all suggest the worst of the selling may be near — but confirmation requires a clear technical trigger.
The two levels that decide everything:
🔴 Below $60,000 — bearish, next target $51,000–$55,000
🟢 Above $67,000 — bullish, recovery toward $75,000–$84,000
Watch the $60,000 floor. Watch ETF flows. Watch the Fed.
Want real-time Bitcoin levels, Elliott Wave counts, and precise trade setups? Access ProSignalTrades Premium →
—
Disclaimer: This analysis is for educational purposes only and does not constitute financial advice. Cryptocurrency trading involves significant risk. Always conduct your own research before making any trading decisions.