For related setups, also read our Gold Bearish Setup at $4,380, our XAGUSD Bullish Reversal and our SLV Forecast.
Gold support has held again, and that is the most important fact on the chart this week. XAUUSD closed Friday near $4,165 after dipping to its lowest level since October 7 midweek and recovering more than 1% in a single session. As long as price stays above $4,130, the structure favours a continuation higher and another test of the $4,300–$4,400 zone.
The technical picture has started to line up with the macro picture. Treasury yields are easing off their highs, and the US dollar has pulled back from an 18-month high. Neither move is decisive yet, but both are moving in gold’s favour at the moment the metal is defending a key level.
Gold Support at $4,130 — What the Chart Shows
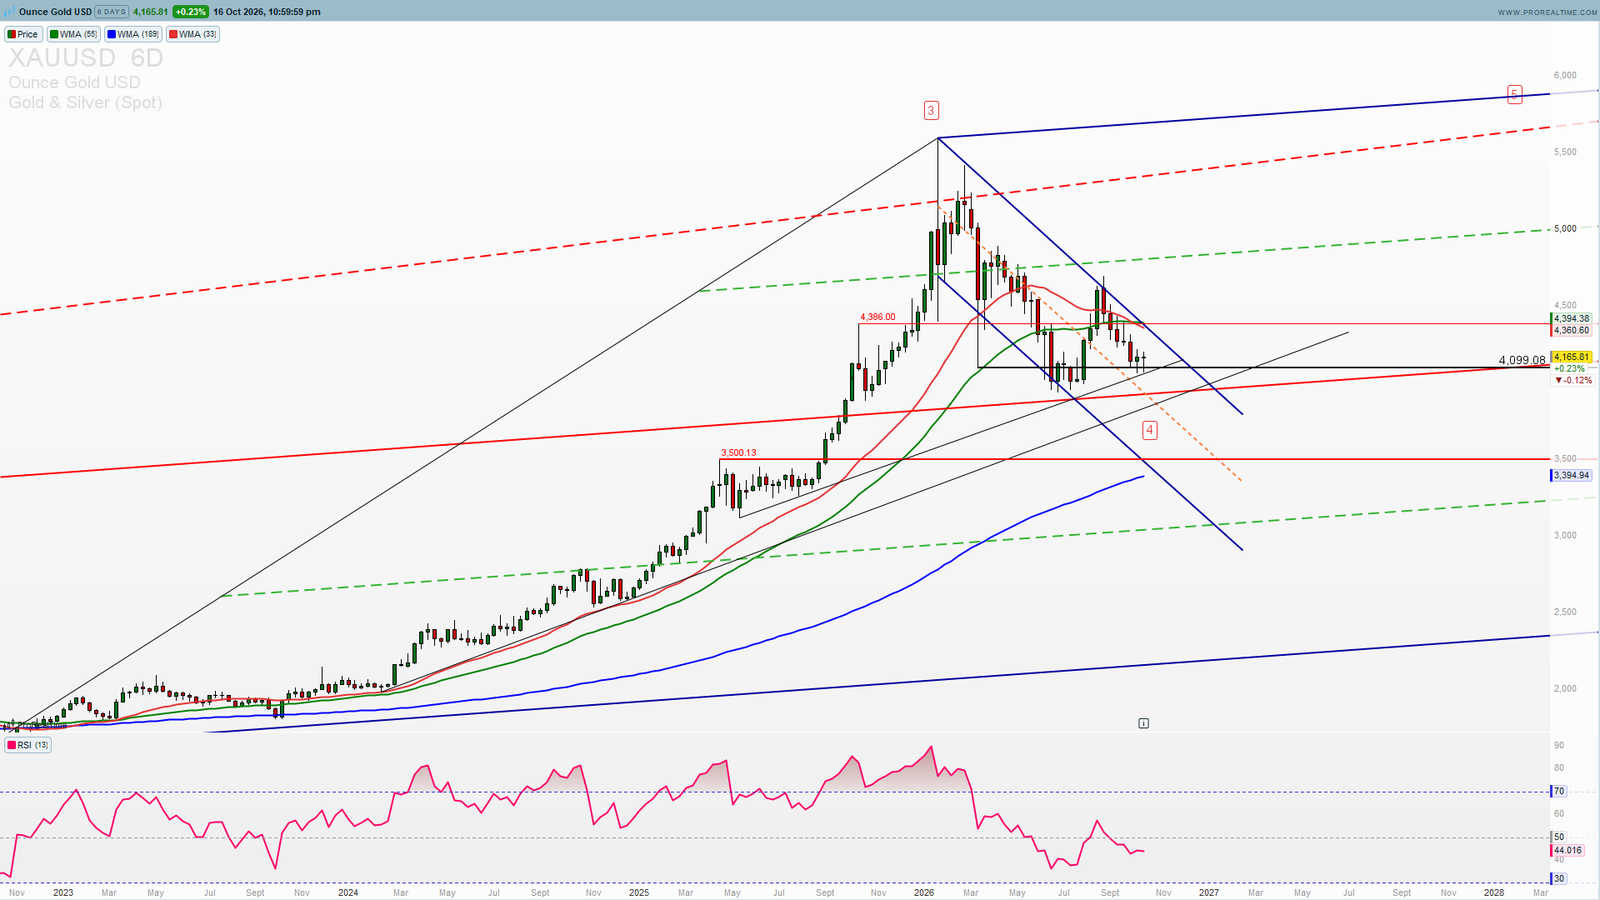
On the higher timeframe, gold is in a corrective phase. The January 2026 peak near $5,580 marks the end of a powerful impulsive advance, and everything since has been a wave 4 correction inside a falling channel. Corrections of this kind are where the longer-term trend rebuilds its base. They are not where it ends.
The Horizontal Floor Is Holding
Price has repeatedly found buyers in the $4,100–$4,130 area. The $4,099 horizontal on the higher-timeframe chart has not been broken on a closing basis, and the most recent dip was bought back within a day. That is how a support level behaves when it is real.
The 4-Hour Chart Has Built a Double Bottom
On the 4H chart, gold printed two lows near $4,070 in October and has since broken the descending trendline from the $4,670 high. The neckline of that double bottom sits at $4,205. The 13 EMA has turned up through the 63 EMA and RSI is in the high 50s, with room left before overbought. A 4H close above $4,205 is the trigger that converts a holding pattern into a move.
Momentum Is Neutral, Not Broken
On the higher timeframe, RSI sits around 44, which is mid-range. Momentum has cooled from the overbought extremes of the January top, but it has not collapsed into the oversold readings that usually come with a trend failure.
Gold Fundamentals — Yields Easing, Dollar Off Its Highs
Treasury Yields Are Coming Off the Top
After New York Fed President John Williams said on October 13 that one more rate hike in 2026 may be enough, the 10-year Treasury yield fell to 5.219% and the 30-year to 5.565%. Lower real yields reduce the opportunity cost of holding a non-yielding asset, which is the most direct channel through which rates affect gold. Strategists polled by Reuters expect the 10-year to drift toward 5% by year-end.
The Dollar Has Retreated From an 18-Month High
The dollar index reached an 18-month high midweek and then reversed lower. It slipped back below the upper boundary of its weekly rising wedge and is now testing support in the 101.49–101.70 zone. Comments from Fed Chair Warsh that upcoming decisions remain open led markets to scale back bets on an October hike, and that took some of the momentum out of the dollar. FXStreet’s analysis of the dollar’s reversal covers the levels in detail.
Why the Dollar Matters More Than the Headlines
Gold does not need a collapsing dollar to rally. It needs the dollar to stop rising. If the index stays inside its range rather than breaking out to new highs, the main headwind that pressed gold lower through September and early October is removed.
The Risk Is Still Inflation
This is not a one-sided picture. September CPI came in at 3.7% year-over-year and PPI at 6.3%, both above expectations. The odds of an October hike have fallen to about 16%, but a December hike is still priced at close to 89%. The 10-year yield is still above 5%. A hot data print before the October 27–28 FOMC meeting could push yields and the dollar back up quickly, and that would put the $4,130 support under real pressure.
Gold Key Levels — The Path to $4,300–$4,400
Support That Must Hold: $4,130
The line that defines the bullish setup. Holding above it keeps the continuation scenario intact.
Trigger: $4,205
The 4H double-bottom neckline. A 4-hour close above it confirms the short-term reversal.
First Target: $4,267–$4,277
Horizontal resistance from the September lows, with the falling 4H 200-period moving average sitting in the same area.
Main Target Zone: $4,300–$4,400
This is where the strongest confluence sits. The $4,386 level was the breakout point of the 2025 advance. The 33- and 55-period weighted moving averages on the higher timeframe are at $4,360 and $4,394. The upper line of the corrective channel also runs through this area. A test of $4,300–$4,400 is the logical destination of a continuation move. A clean break above it would be the first real evidence that the wave 4 correction is complete.
Invalidation: Below $4,070
A close below $4,130 weakens the setup. A break of the $4,070 double-bottom lows invalidates it and opens the way toward the lower channel boundary.
What to Watch Before the October 28 Fed Decision
Dollar Index at 101.49–101.70
If the dollar closes below this support zone, the next level is 101.10, and gold’s path toward $4,300 gets easier. If the dollar reclaims its weekly wedge, gold’s rally attempt is likely to stall at $4,205 again.
The 10-Year Yield Around 5.2%
A continued drift toward 5% supports the bullish case. A move back toward 5.3% would put it at risk.
Gold Support Summary
XAUUSD at $4,165:
🟢 Bullish above $4,130. A 4H close above $4,205 confirms, with targets at $4,267–$4,277 and then $4,300–$4,400.
⚠️ Neutral between $4,070 and $4,130. Support is under pressure and there is no edge until it resolves.
🔴 Invalidated below $4,070. The double bottom fails and the lower channel boundary opens.
Gold support at $4,130 has held through a week that included an 18-month high in the dollar and above-forecast inflation data. Now that yields are easing and the dollar is retreating, the conditions for a continuation are in place. The setup depends on one level below and one zone above: $4,130 must hold, and $4,300–$4,400 is where the next real decision gets made. We will publish a follow-up on this call whichever way it resolves.
Get the Full Gold Wave Count — €299 Annual Until October 24
This post covers the setup. The full Elliott Wave count on gold, with entries, stops and position sizing, goes to PST All-Access members first.
Until October 24, the annual plan is €299 instead of €399. That works out to €24.92 per month, compared with €69 on the monthly plan.
All-Access includes the PST Terminal with live charts and news, the Elliott Wave and ICT scanners, the full institutional research library, Telegram signals and WhatsApp alerts.
Use code IMPULSE at checkout → prosignaltrades.com/setup/
30-day money-back guarantee, no questions asked.
—
Disclaimer: This analysis is for educational purposes only and does not constitute financial advice. Trading involves significant risk. Always conduct your own research before making any investment decisions.