Fundamental overview
However, growing leverage in derivatives and fading spot demand pose risks for sharp moves.
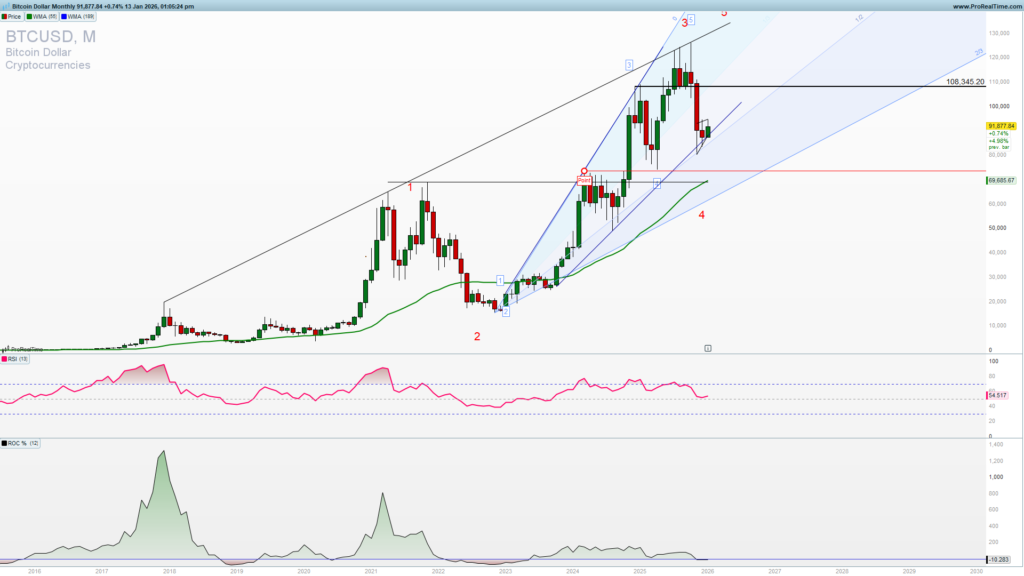
Bitcoin is consolidating above support
Bitcoin is holding above the 87000 support for now and is forming a consolidation wedge which could be broken in the near future. The upside resistance level for the continuation higher into 108345 is 95000. A break below 87000 would turn a spotlight to 69000-73000 zone as it can be seen on the monthly chart.
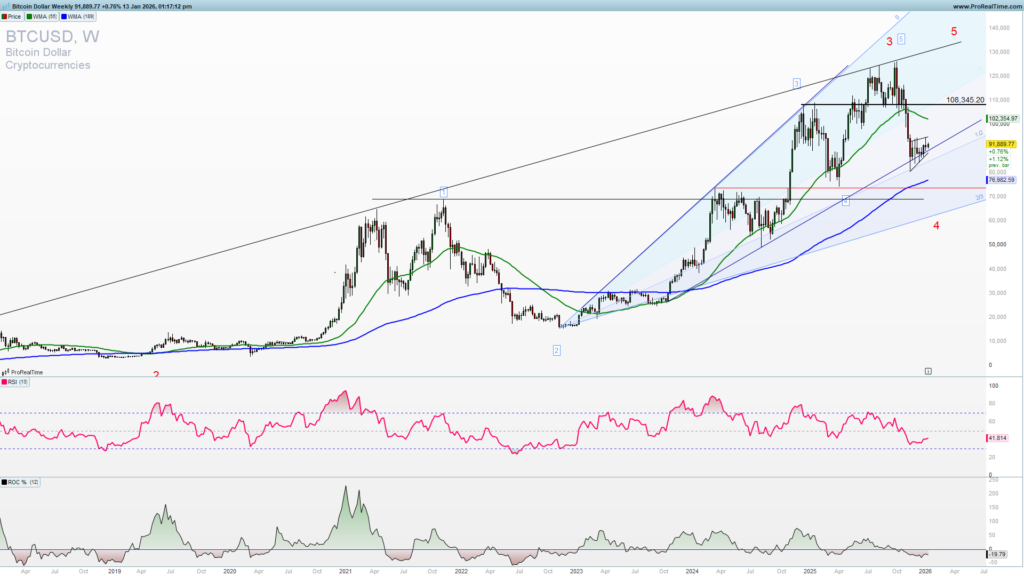
On the weekly chart we can see a clear upside five waves from the low and we will have fourth wave finished now with a run into a fifth wave to follow or we will see an extended correction into 70000 for a fourth wave finish. There is also a 73000-76000 support zone before 70000. Still long-term uptrend is not jeopardized and is still very valid and active.
Dynamic of this price action suggest (join to get premium analysis and everyday updates with a free prop trading challenge account from partners) cautious approach. Long trade entry has a low risk and also good risk to reward if you place stops below 88000.
A push above 95000 would lead to a breakout higher and a clear ride to 108000 giving you a high reward for a low risk.
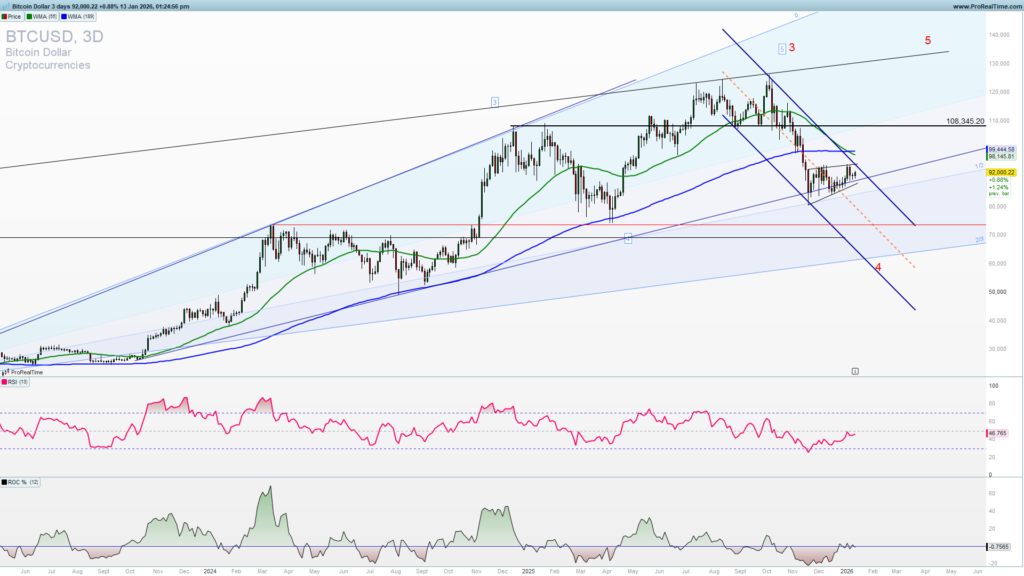
On the other hand if we get a break below 88000 we could see an extension downside to 70000-73000 zone giving a short trade also a good risk to reward. Place short trade entries only in the case of a clear break below 88000.
Trade safe!