Fundamental overview
U.S. stocks eked out modest gains as investors wrapped up a volatile week of trading — a sign of cautious sentiment heading into the long weekend.
On Friday Jan 16, the S&P 500 closed slightly lower (≈-0.1%), with slight losses also seen in the Dow and Nasdaq — reflecting mixed earnings and market rotation.
Earlier in the week, the index pulled back from record highs amid mixed corporate earnings and profit warnings from big banks and airlines.
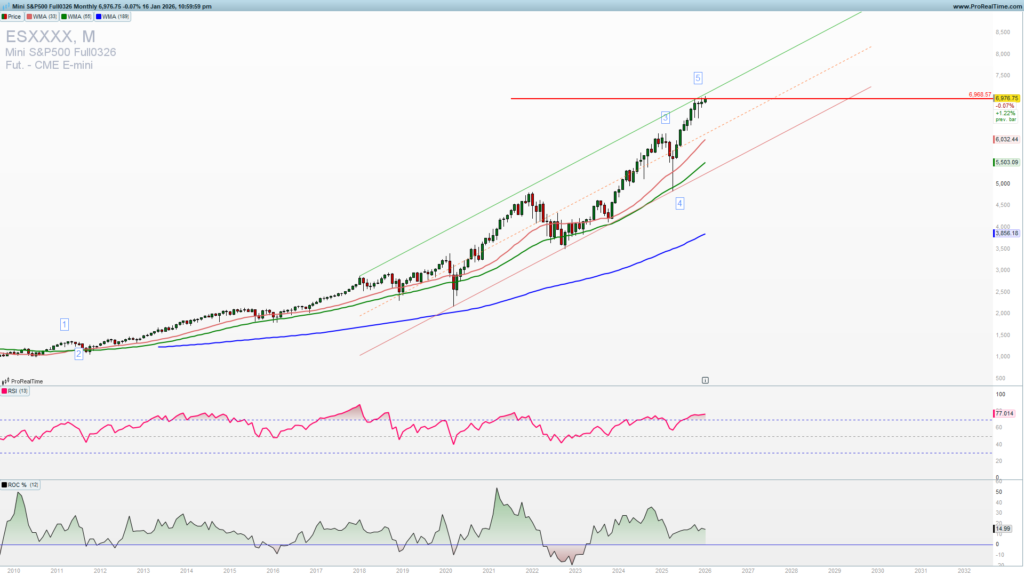
SPX is being rejected by the channel
SPX is being rejected by the long-term uptrend channel 7000. We are seeing small range monthly candles. This could be an early sign of an uptrend exhaustion. This could be the fifth wave from the 2010 low. If that would be the case we will see a substantial reversal lower. If the upside continues from here without a pullback 7200 as a target.
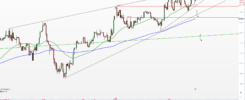
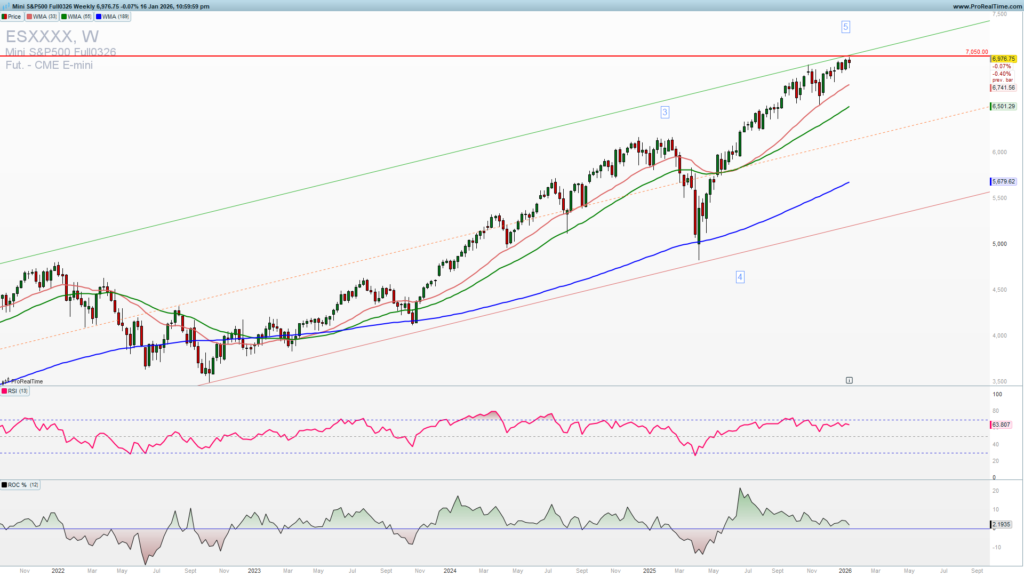
On the weekly chart we see an upward price action but with a negative oscillators divergence. This is also pointing to a weak momentum as we are heading into a key week which could bring either an upside extension or a reversal lower. I am more inclined to a reversal lower because of the technical factors and the fact that positive market news were not enough to push the prices higher. Inflation in the US is not lower, employment is stabilizing and yields are going higher despite the FED lowering benchmark.
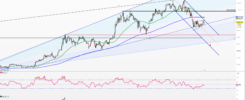
Dynamic of this price action suggest (join to get premium analysis, weekly and mid-week newsletter and other tools for for your successful trading) indecision, but as mentioned we have more bearish signals. There is a bearish rising wedge and a clear downside and upside resistance levels. Upside resistance is 7050 and a downside resistance is 6910.
I am looking for an early week signs of reversal lower with a possible attack on 6910. Ab break below 6950 and 6910 would give a high probability short trade setup to target November low at least.
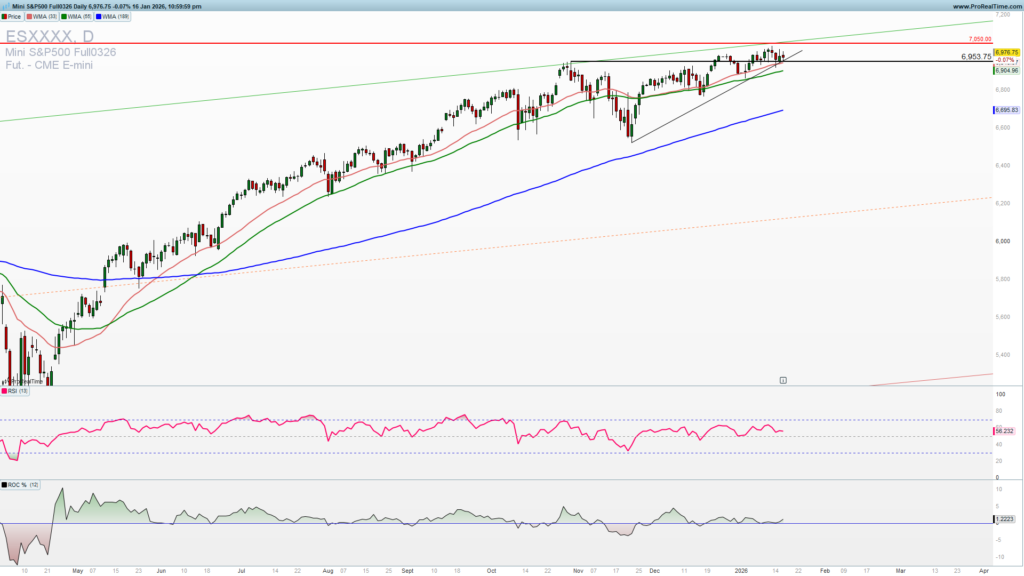
Looking higher only a break above 7050 will lead to an upside continuation but a risk to reward for the long trade entries is low. Not a time to be bullish on market.
Trade safe!