

For related setups, also read our Gold and Nasdaq Outlook and our Nasdaq 100 Forecast.
The SOX index has reached the level that matters most on its chart. After an eight-session losing streak, the longest for chip stocks in nearly two decades, the Philadelphia Semiconductor Index is trading near 10,780. That puts it on two supports at once: the rising lower boundary of a large triangle, and the 200-day moving average at 10,690. RSI(13) is at 31, close to oversold.
This is where the structure decides between two outcomes. Holding here makes the decline from the September high a correction inside a bullish triangle, a pattern that typically resolves in the direction of the prior trend. That trend was a move from roughly 3,500 to 14,700. Losing it would turn the correction into something larger.
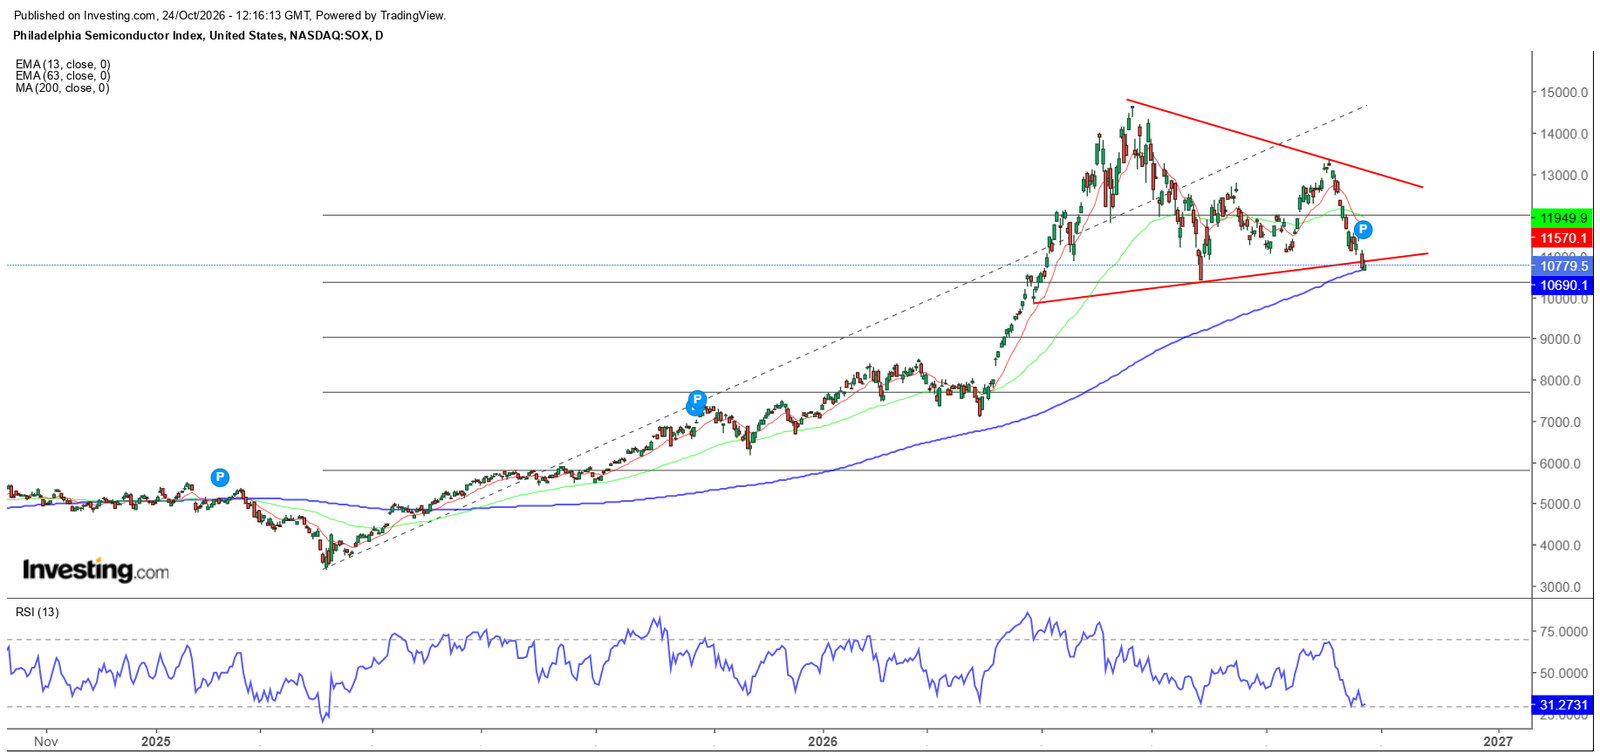
SOX Index Structure: A Bullish Triangle After a 4x Run
From the 2025 low near 3,500, SOX more than quadrupled into a peak near 14,700, riding a rising channel almost the entire way. Since that peak, price has not trended lower. It has contracted.
Descending Resistance
The upper line connects the 14,700 peak with the lower high near 13,300. It now sits around 12,700 and falls with every session.
Rising Support
The lower line connects the low near 9,900 with the higher low near 10,450 and runs through today’s price at roughly 10,800. Higher lows against lower highs make a symmetrical triangle. After a strong advance, it is usually a continuation pattern.
Elliott Wave Read
In Elliott terms, a triangle appears in a wave 4 position, the last consolidation before a final impulsive leg. If this count is right, the current test of the lower boundary is wave E or the end of wave C of the triangle. That is the final low before the breakout.
Momentum
The 13 EMA (11,570) has crossed below the 63 EMA (11,950), so short-term momentum is negative. But RSI at 31 is near the levels that marked the previous swing lows inside the triangle, and price is sitting exactly on the 200-day average, which has not closed below since the 2025 low.
What Drove the Chip Selloff
The Lam Research Supply Warning
The latest leg down came after Lam Research said on its October 21 earnings call that it was managing supply chain constraints. Management added that clean room space and certain components would keep limiting chipmakers into 2027. Marvell and AMD fell about 8% and Intel about 7% the next day, according to 24/7 Wall St.
Why That Is Not a Demand Problem
A supply constraint means the industry cannot build fast enough to meet orders. That is a margin and timing issue, not a collapse in demand. The market sold it as if it were the latter.
Positioning Is Stretched
SOX fell more than 12% in seven sessions. Short sellers have booked roughly $32 billion in paper gains on chip stocks, according to S3 Partners data reported by Quartz. A crowded short at major support is the kind of setup that can fuel a sharp reversal.
The Macro Headwind
This is not a clean picture. The 10-year yield is near 5.0%, oil is above $100, and markets price a December Fed hike at about 71%. The FOMC meets on October 28. A hawkish surprise could test the support before any bounce.
SOX Key Levels
Support 1: 10,800, the Rising Triangle Line
The lower boundary of the triangle. The first test happens here.
Support 2: 10,690, the 200-Day Moving Average
A daily close below the 200-day average would be the first since the 2025 low.
Support 3: 10,450, the June Low
The higher low that defines the triangle. A daily close below it invalidates the pattern and opens 9,000.
Resistance: 11,570 → 11,950 → 12,700
The 13 EMA, then the 63 EMA together with horizontal resistance, then the descending triangle line. A daily close above 12,700 confirms the breakout.
Upside Targets
The first objective is a retest of the 14,700 high. The triangle’s height (about 4,800 points) projects toward 17,500 from a breakout near 12,700. That is the full measured move and would take time.
SOX Index Summary
SOX at 10,780:
🟢 Bullish above 10,690 with a reclaim of 11,570. Triangle intact, targeting 12,700 and then a run at new highs above 14,700
⚠️ Neutral between 10,450 and 10,690. Support is under pressure
🔴 Invalidated on a daily close below 10,450. The triangle fails and opens 9,000
The semiconductor trade has been shaken, not broken. Price has corrected into the exact confluence where a bullish triangle should hold: the rising trendline, the 200-day average and oversold momentum, all with short sellers sitting on record gains. The structure points higher as long as 10,450 holds. Below it, the pattern is wrong, and we will say so.
Want the stock-level picture? Our 11-Stock Institutional Research Bundle covers NVDA, AMD, MU, SK Hynix and CoreWeave, with valuation, price targets and the bull versus bear case for each.
Last Day: IMPULSE Ends Tonight
The full SOX wave count, with entries and stops on the leading chip names, goes to PST All-Access members first.
Today is the final day of IMPULSE: the annual plan is €299 instead of €399, and that price stays locked on every future renewal. Every new member also gets 2 months of TradingView Essential, and everyone who subscribes before midnight receives one more special surprise.
All-Access includes the PST Terminal with live charts and news, the Elliott Wave and ICT scanners, the full institutional research library, Telegram signals and WhatsApp alerts.
Use code IMPULSE at checkout → prosignaltrades.com/setup/
30-day money-back guarantee, no questions asked.
—
Disclaimer: This analysis is for educational purposes only and does not constitute financial advice. Trading involves significant risk. Always conduct your own research before making any investment decisions.