Fundamental overview
- Inflation and Monetary Policy: With U.S. inflation remaining sticky and the Federal Reserve in a rate-cutting cycle, lower interest rates are expected to support precious metals. President-elect Trump’s push for even more aggressive cuts and a potential Fed chair replacement could accelerate quantitative easing (QE), weakening the dollar and boosting silver as an inflation hedge. A breakdown in the dollar’s 15-year trendline could further propel prices upward.
- Geopolitical Tensions: Escalating conflicts, such as potential U.S. involvement in Venezuela or stalled Russia-Ukraine peace talks, may drive safe-haven buying. BRICS nations’ shift away from dollar dominance, including potential metal-backed currencies, could increase physical hoarding. China’s dominance in silver supply (60-70% of new ounces) and upcoming export restrictions in 2026-2027 add uncertainty, potentially tightening global availability.
- Economic Growth and Stagflation Risks: Stagnating growth amid persistent inflation (stagflation) favors commodities like silver. However, if global growth slows more than expected, industrial demand could soften, leading to corrections.
- Supply Constraints: Mine production remains flat, with new projects facing 10-15 year lead times. Recycling is limited, and structural shortages are projected at 30-95 million ounces for 2026. China’s export curbs could exacerbate this, pushing physical premiums higher.
- Demand Surge: Industrial use now exceeds 50% of total demand and is accelerating:
- Solar Energy: Expected to consume 130-150 million ounces in 2026, as global capacity expands to 2,300-2,500 GW. Demand could double by 2030.
- Electric Vehicles (EVs) and Electrification: EVs use 2-3 times more silver than traditional vehicles; global sales are forecasted to rise sharply, alongside grid expansions.
- AI and Data Centers: Energy needs from data centers are set to double by 2026, with AI hardware requiring significantly more silver. Electronics and 5G/6G tech add further pressure.
- Investment Demand: Retail and institutional inflows are growing, with silver outperforming stocks (e.g., breakouts vs. S&P 500 and Nasdaq) and even Bitcoin. However, paper market suppression may be waning, leading to a decoupling of physical and futures prices.
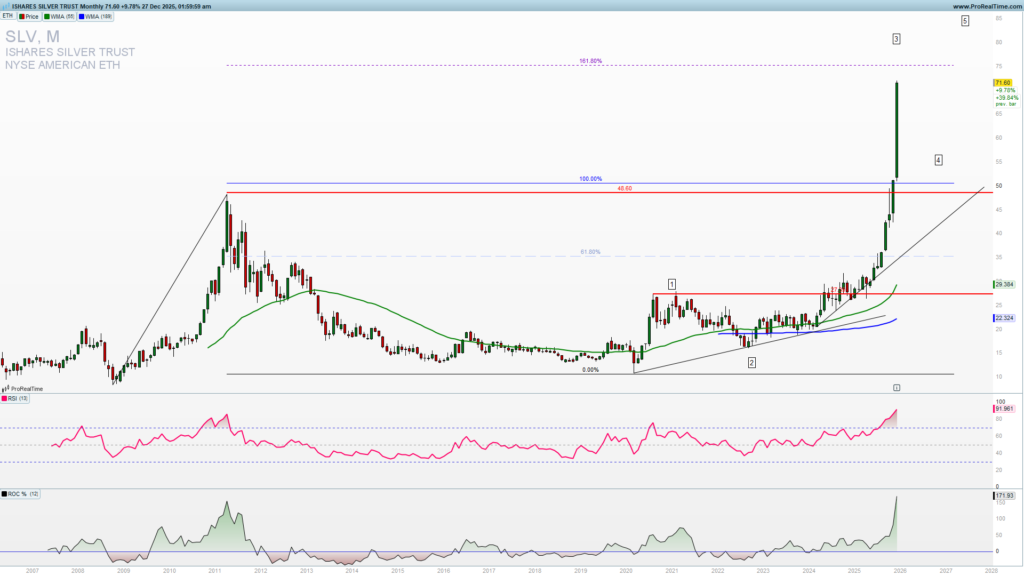
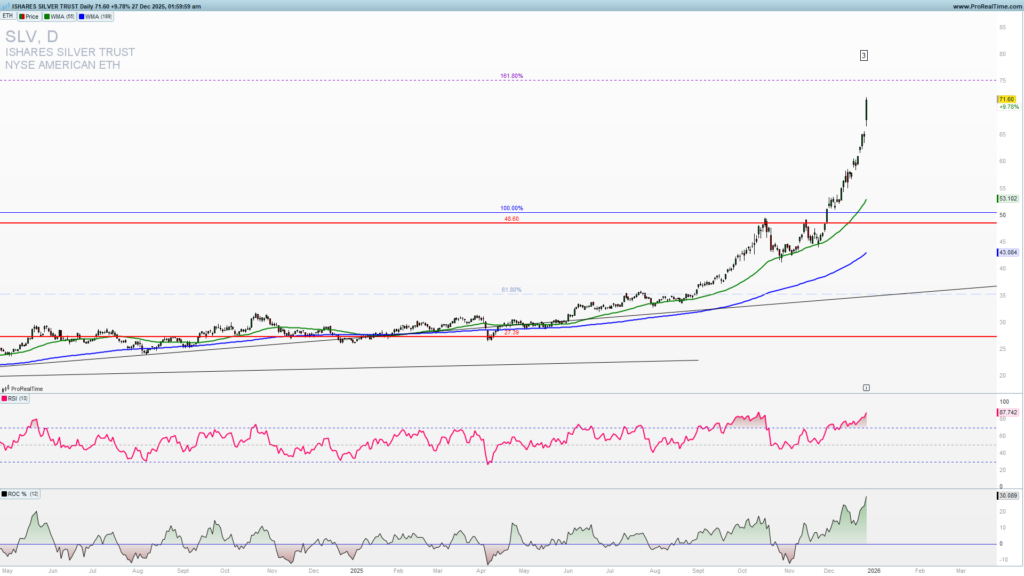
Silver parabolic rise
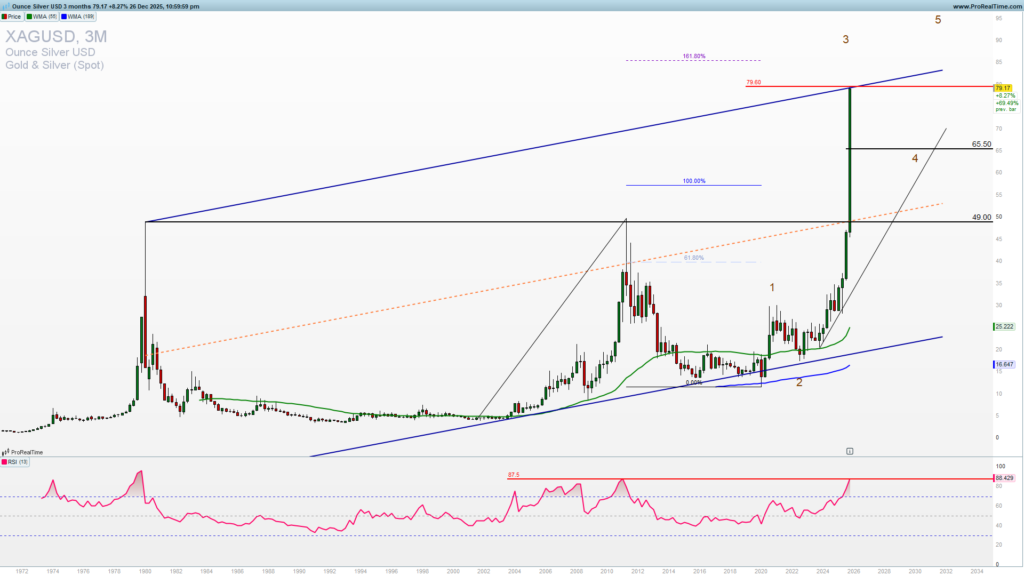
Silver is reaching 80 level. It is now the top of the multiyear uptrend channel and a possible third Elliott wave high within a reach. We could get an overthrow and a possible extension to test 161.8% Fibonacci upside target from July 2001 low. It is a 86 level. This is where parabolic rise could end for a medium-term.
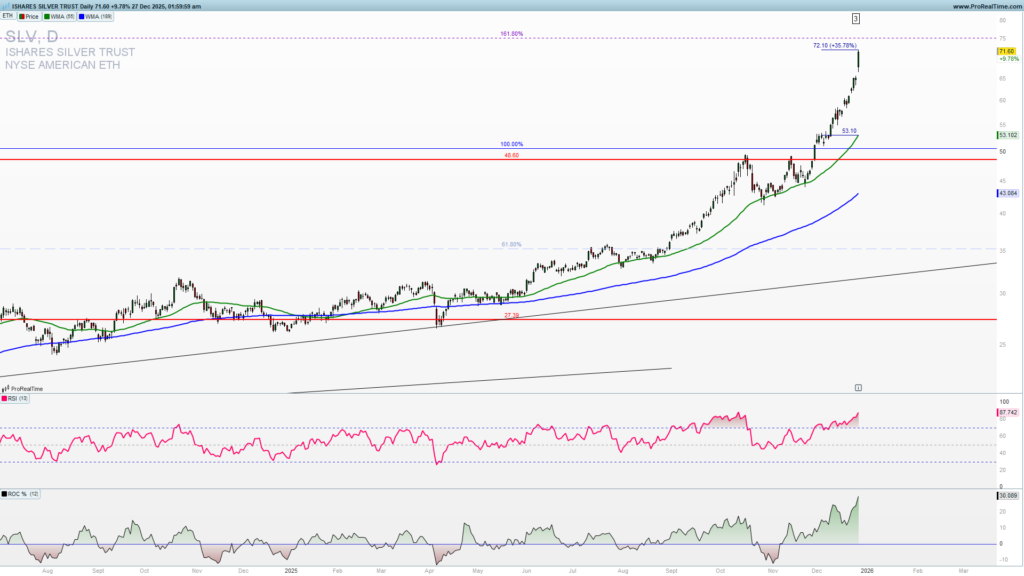
Monthly chart of SLV reveals the same path as this ETF is tracking the market price of Silver. Fibonacci extension 161.8% here is 75. It is an upside target till the 15th of January 2026. It is the first possible resistance as these prices are historically high and we do not have any levels to compare in the near or distant history. We should see a pullback from here to keep the volatility of the instrument under the control. Anyway shorting here is not advised yet, or if you want to try with the short trade SLV or Silver you should have tight stops.
Dynamic of this price action suggest (join to get premium analysis and everyday with a free prop trading challenge account from partners) that we are not at the top still and we should have a one more push higher to test 75 before any possible pullback.
A push above 75 would lead to an extreme levels and will leave SLV overbought and vulnerable to speculative short positioning exposing higher margins and leverage trading that will lead to volatile price swings.
If we take a look at logarithm price scale we could see that historically we did not have such a distance from the closest moving averages. It is almost 40% distance. The highest distance was 21% so we should see soon adjustment of the prices as the institutions would start to take profits.
Trade safe!