Is Oil the New Gold? Navigating a Breakout Week in Energy Markets
USO ETF is reviving
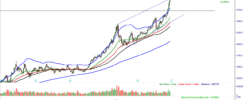
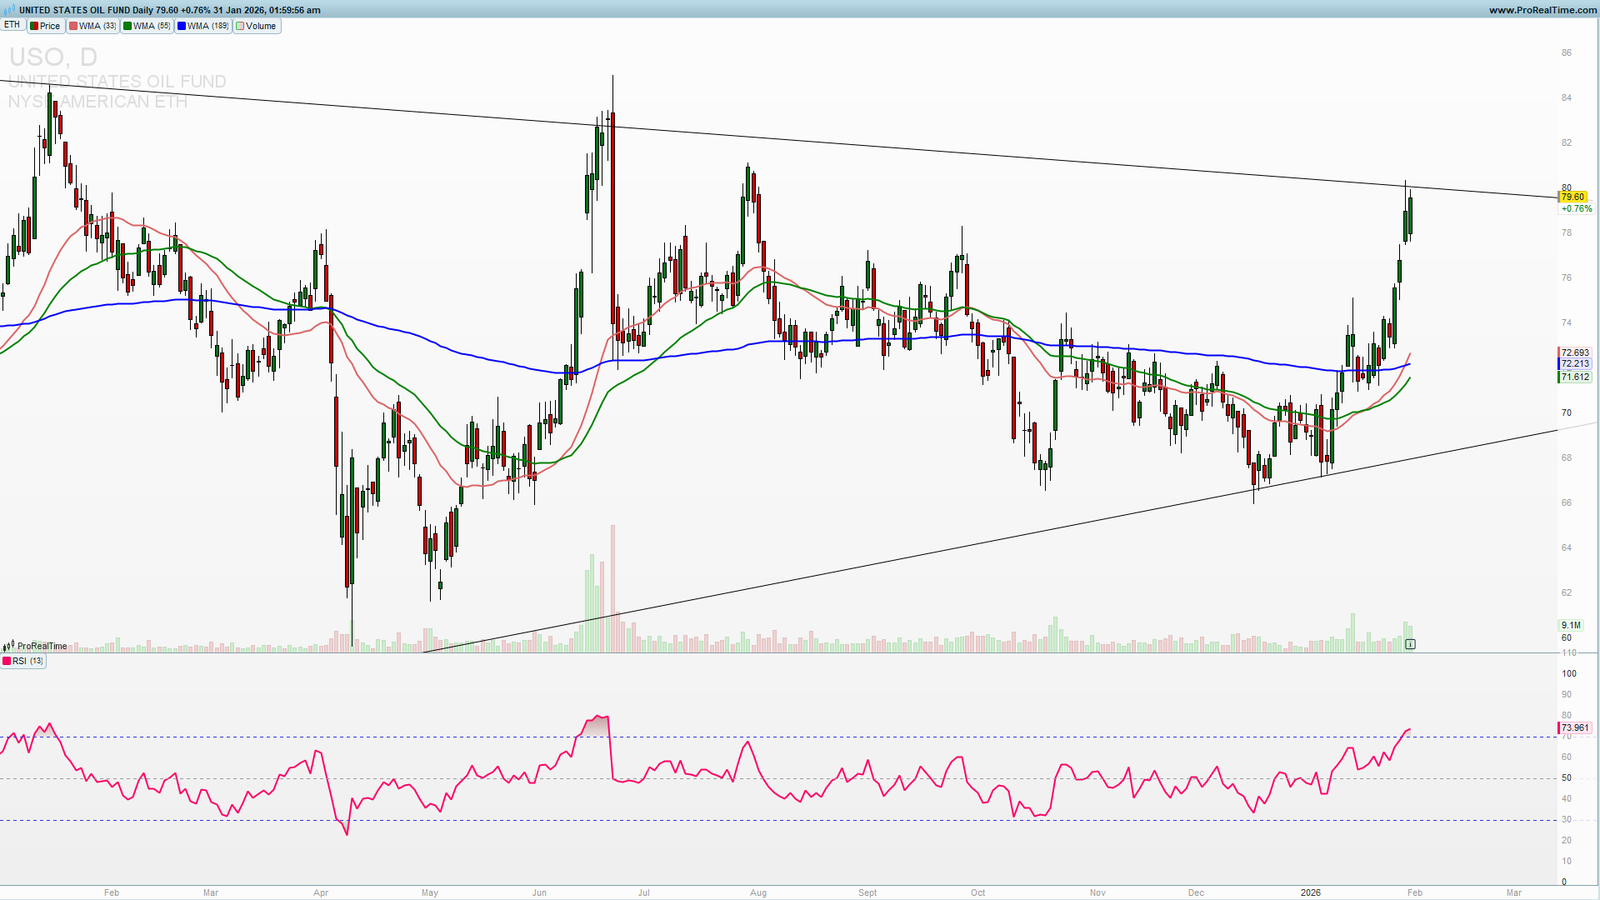
USO ETF felt during the years and is in the consolidation basing triangle with a major resistance 80 now being tested as the Oil prices rising in the last week. Volume is also rising as we can see on a daily chart and this looks like a Gold consolidation and buying pressure that led to a parabolic rally to the upside. By comparing those two we can draw some parallels which are pointing to a new energy rally which you do not want to miss.

Oil is testing the first important upside resistance
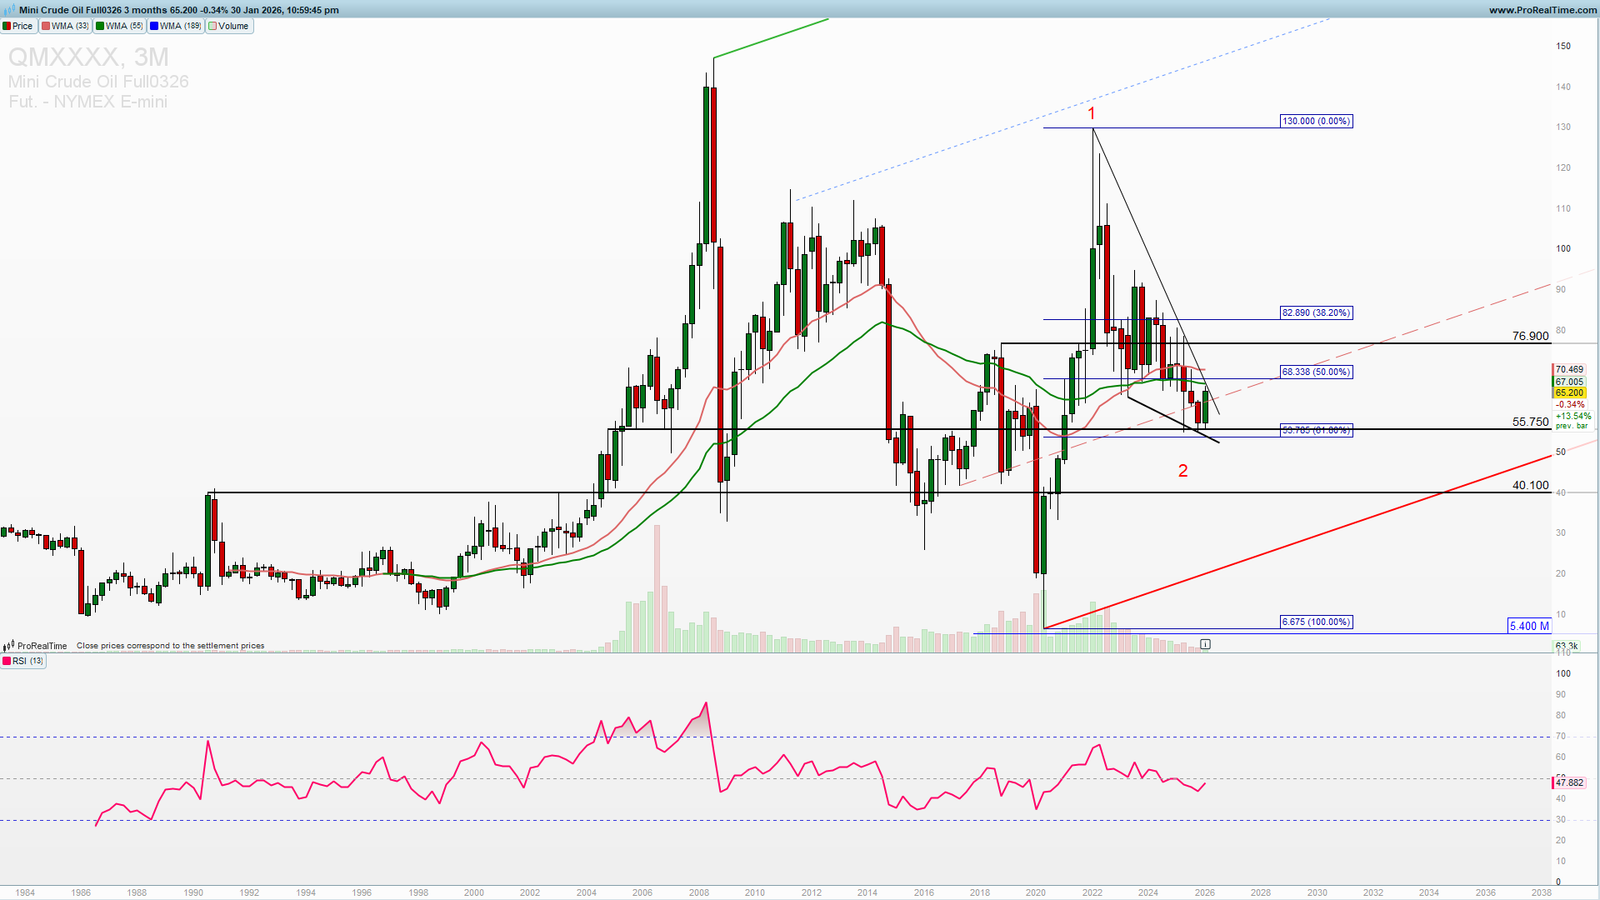
Oil bounced from 55.75 and rallied higher into a strong first resistance. This is a downtrend line and a horizontal resistance 68.300. A break above this resistance will open 75 which is the second most important resistance on the way higher. Next week we need to see a breakout above the 68.300 with a strong daily close to confirm an escape from a multiyear consolidation like Gold had.
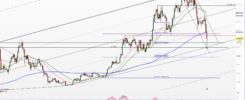
On the weekly chart you can see a strong cluster of the resistance (join to get premium analysis, weekly and mid-week newsletter and other tools for for your successful trading) indicated on the long-term chart. You can see that the price action in the declining wedge so squeezed for weeks and the major move is ahead.
Trade this setup with my preferred broker 👇
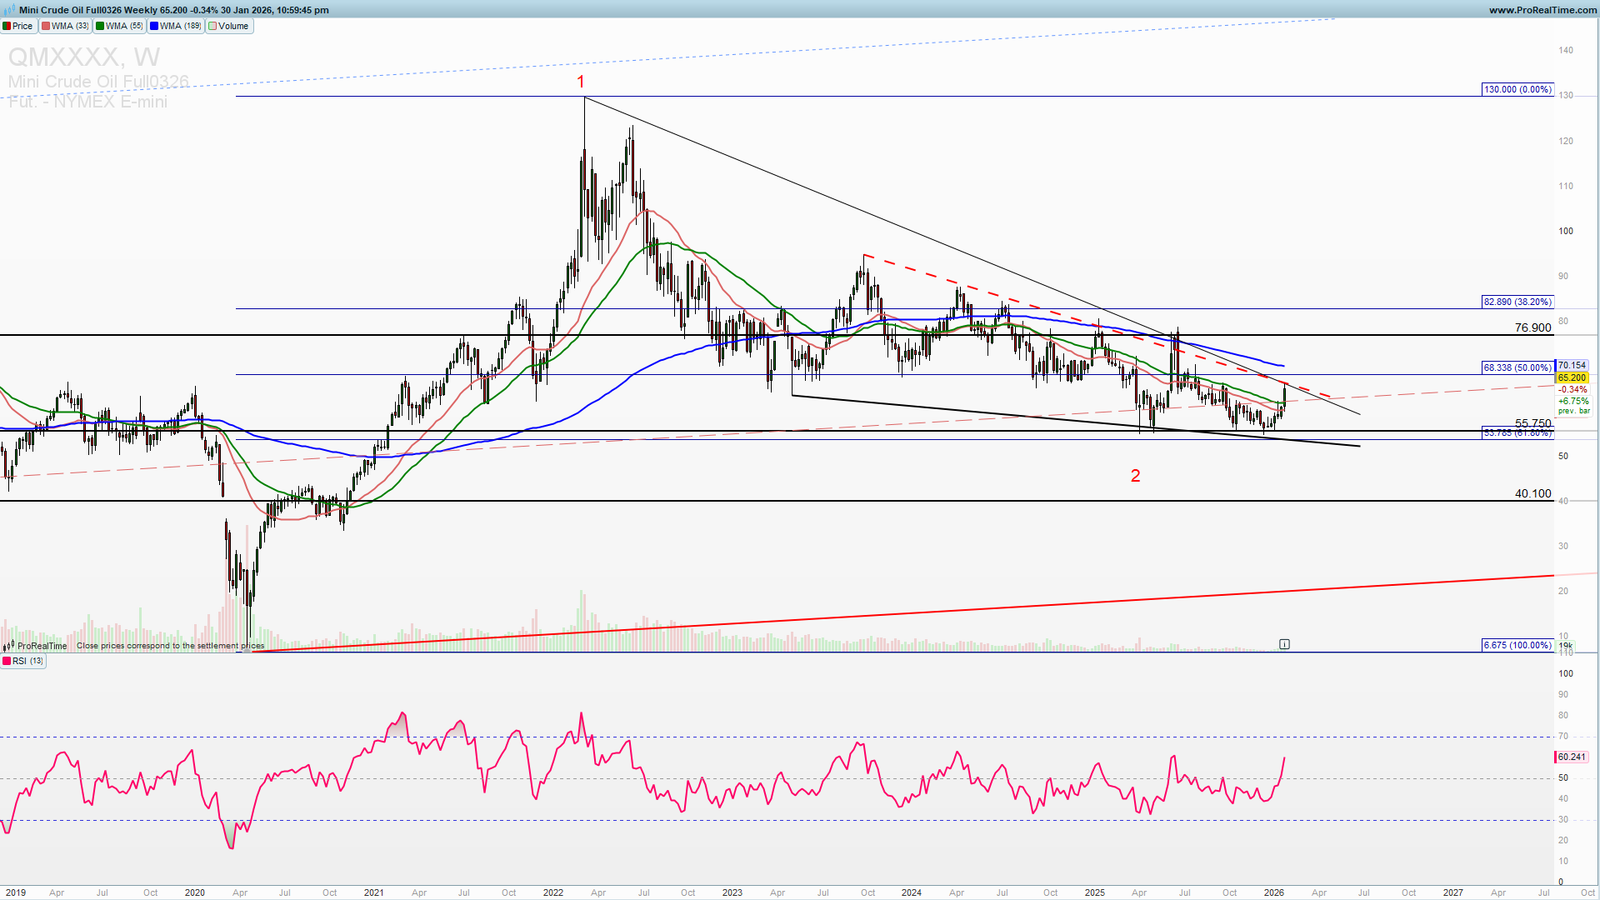
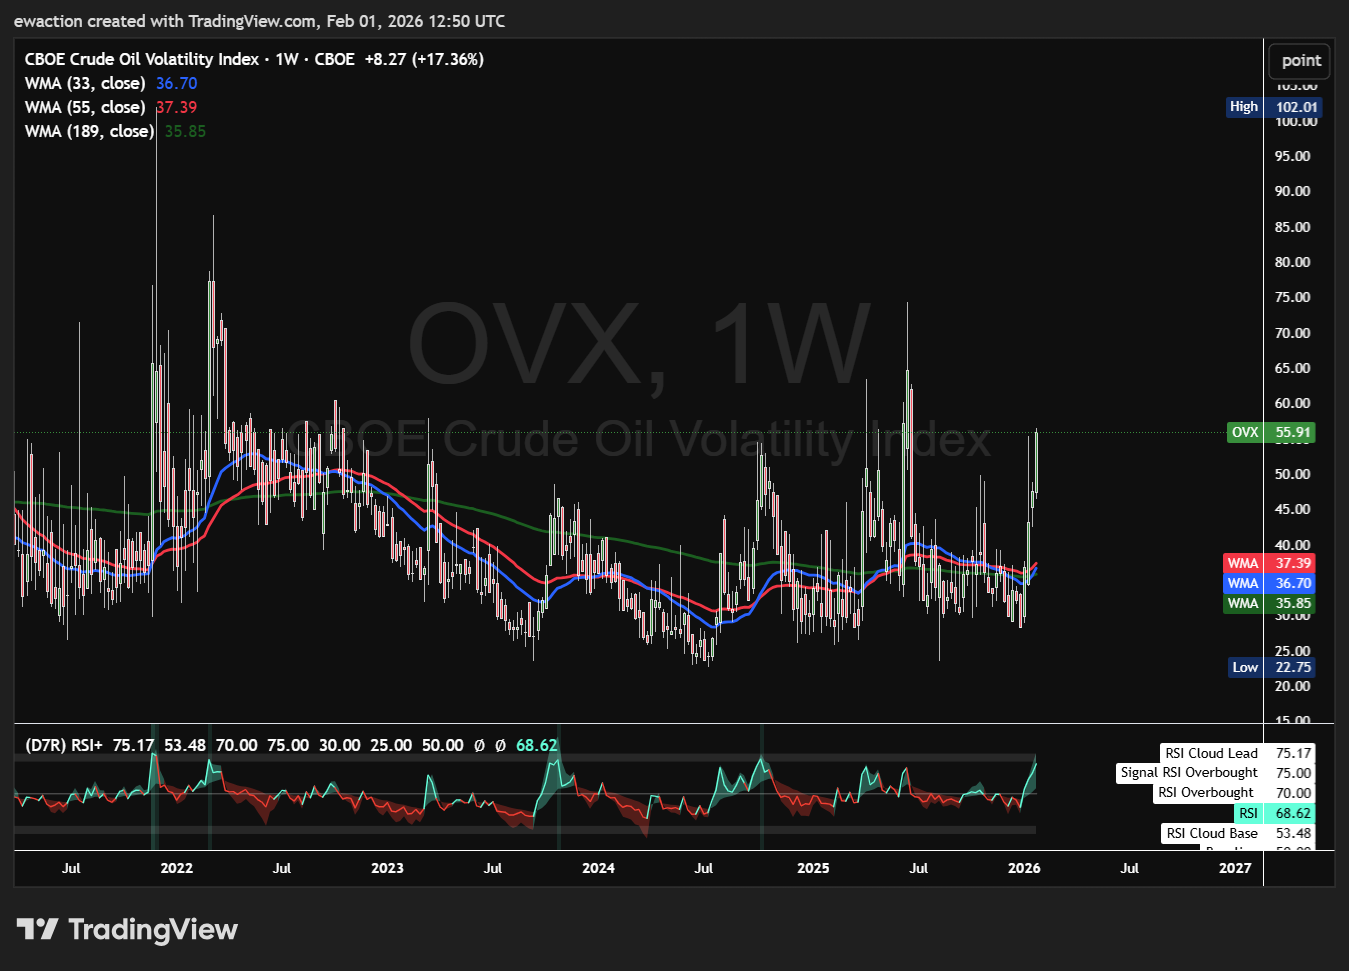
Friday indecision candle is just a pause before a possible brief pullback before another final attack on 68.300. This is the breaking point and a confirmed daily close above this level will lead to a strong continuation higher and a Gold look a like move which came from a years of consolidation. Oil price was pressured during the Russia Ukraine war by administrative measures that targeted the Oil international trade but the volatility is coming back as you can see on the OVX Oil volatility Index chart.
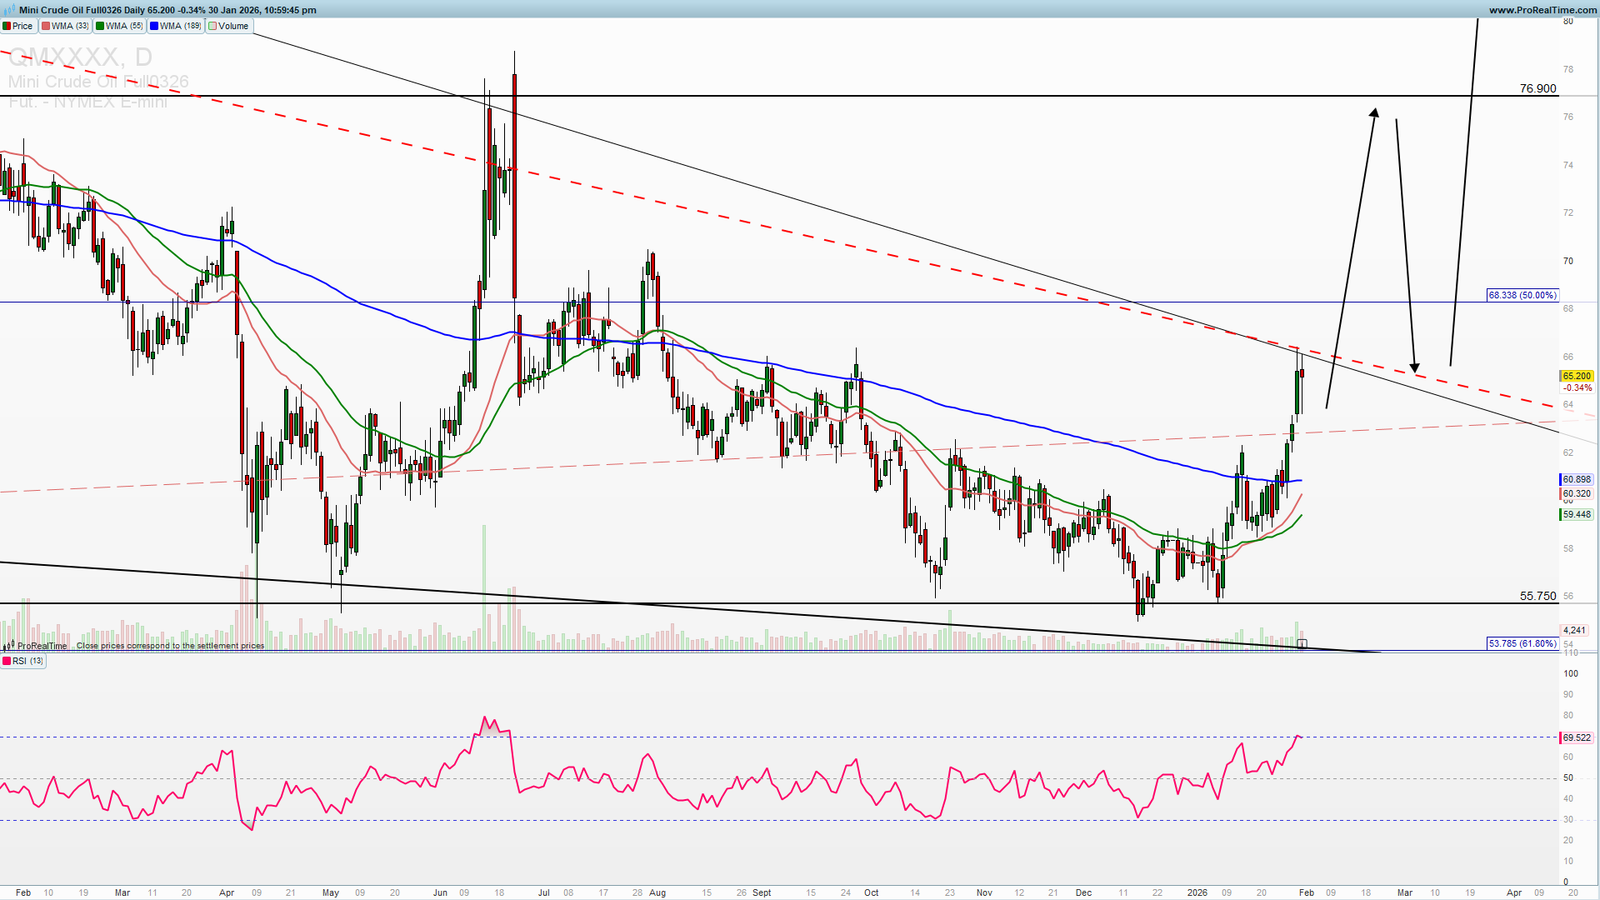
You can use the possible pullback early next week for a buying opportunity.
Trade safe!